2019 saw bond yields turn around from their climb in 2018 and move lower. Since the Federal Reserve changed their language last December to being accommodative and data-driven, we have seen yields across the board come down a lot.

There is no question that this drop in yields was driven, in large part, by what were low or negative yields in Europe and Japan. The 10-year Treasury started the year at 2.70% and ended the year at 1.90% after making a low in early September at 1.45%.
The drop in Treasuries in the latter part of the summer was dramatic. We saw the 10-year Treasury move from a 2% yield to 1.50% in the space of two weeks as US yields moved to catch up on the downside with European and Japanese yields.
Muni yields also saw a significant drop in the year, with 10-year AAA muni yields moving from 2.28% to 1.44% and 30-year AAA munis moving from 3.02% to 2.09%. The drop in muni/Treasury yield ratios was impressive, with the 10-year yield ratio moving from 84% to 76%; but just as impressive was the 30-year muni ratio/Treasury’s moving from 100% to 88%.
What are some of the takeaways?
* The flattening Treasury yield curve – which was such a source of concern in the summer – unflattened. As we have written, we never saw the flattening curve as much of a concern, because it was accompanied by long yields falling as opposed to short-term yields being jacked up by the Fed. Indeed, the Treasury yield spread between the 2-years and 10-year has risen from a minus 5 basis points in late summer to 26 basis points currently.
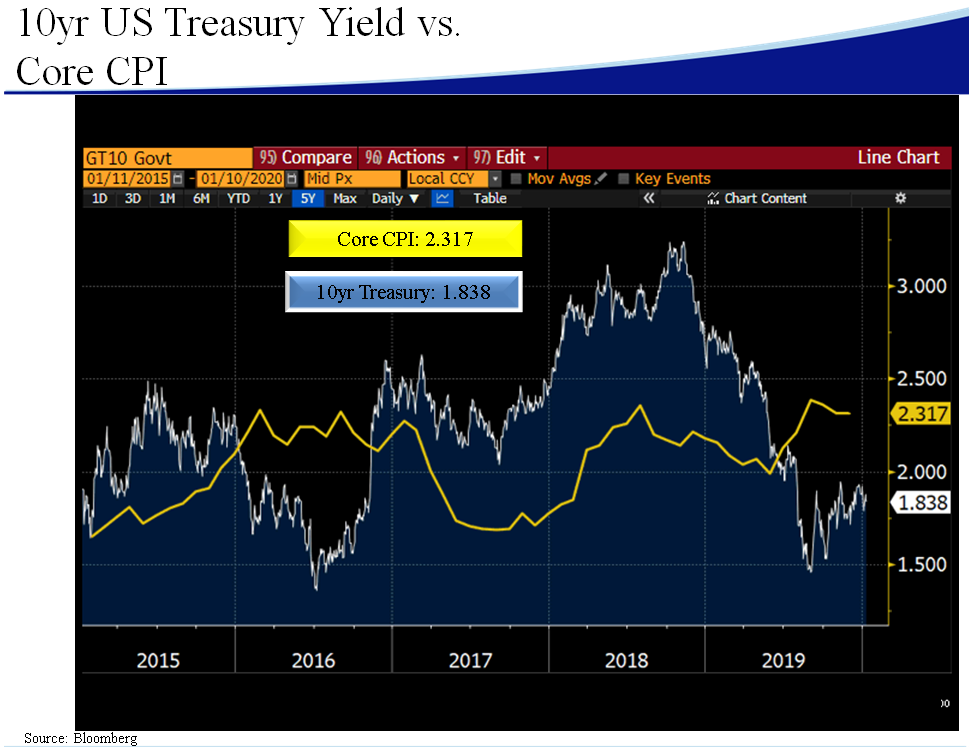
* Inflation has remained steady. Core inflation began the year at 2.2%. The trailing twelve-month is 2.3% as of November. This means that the 10-year bond REAL yield went from +50 basis points to -40 basis points currently. We know that negative REAL yields generally don’t last. They didn’t last in 2016, and we don’t think they’ll last now. Election years tend to be volatile in that regard.
* The muni story was impressive. Not only did ratios drop, but muni supply ended up an impressive $424 billion after 2018’s $338 billion. The increase really came from two sources. Issuers took advantage of low rates just to sell new money, locking in almost historically low long rates. But we also saw a phenomenon that wasn’t being considered in the higher interest-rate environment of 2018. That is, issuers used the taxable bond market to advance refund older higher-coupon debt, to the tune of $70 billion taxable issuance in 2019. The 2017 tax bill took away tax-exempt advance refundings. However, with the drop in rates, many issuers could issue taxable paper and refund bonds that might have had 4.5%+ original yields and 2–3 years left to call dates. The cost savings on out years more than make up for the negative interest-rate differential between taxable muni rates and Treasury rates.
* Demand continued to be voracious for munis in high-tax states such as California, New York, and New Jersey. The 2017 tax bill eliminated deductions for state income taxes and local property taxes, so there are few places other than munis from which to get a tax-free income flow. Also, bond fund inflows were dramatically higher than in 2018. We expect this demand to continue, although shorter-term tax-free yields are very expensive – look at the end of the year shorter-maturity ratios in the mid-60 percentiles!
* The terrific stock market of 2019 (S&P up 31%) bolstered municipal pensions. But the lower interest rates will hurt discounted liabilities as well as assumed returns going forward.
As we move into 2020, the negative real yields in Treasuries are causing us to play defense in bonds. That means a continuation of a barbell strategy, with some longer paper offset by shorter defensive structures. Given that the Federal Reserve cut the fed funds target three times in 2019 (the rate now sits at a target range of 1.50–1.75), we feel the Fed will play a pat hand for the most part in 2020, in part because they want to see what the effects of their rate cuts are and also because, in an ideal world, they would like to stay out of the political fracas.
Presidential election years are always interesting and usually volatile. We will keep everyone informed.
John R. Mousseau, CFA
President, Chief Executive Officer & Director of Fixed Income
Email | Bio
Links to other websites or electronic media controlled or offered by Third-Parties (non-affiliates of Cumberland Advisors) are provided only as a reference and courtesy to our users. Cumberland Advisors has no control over such websites, does not recommend or endorse any opinions, ideas, products, information, or content of such sites, and makes no warranties as to the accuracy, completeness, reliability or suitability of their content. Cumberland Advisors hereby disclaims liability for any information, materials, products or services posted or offered at any of the Third-Party websites. The Third-Party may have a privacy and/or security policy different from that of Cumberland Advisors. Therefore, please refer to the specific privacy and security policies of the Third-Party when accessing their websites.
Sign up for our FREE Cumberland Market Commentaries
Cumberland Advisors Market Commentaries offer insights and analysis on upcoming, important economic issues that potentially impact global financial markets. Our team shares their thinking on global economic developments, market news and other factors that often influence investment opportunities and strategies.
