This is a brief overview of Cumberland Advisors’ thoughts on financial markets as we head into the second half of 2025. It is a particularly important outlook given the fact that we have just witnessed an almost unprecedented amount of Presidential activity for the first 6 months of a new administration. With the recently passed budget bill including tax discussions, tariffs and their implementation (and pullbacks), immigration policies, and discussions about the Fed chair, there has been no shortage of volatility in the markets, particularly at the beginning of the second quarter. As we started the second half of 2025, it was instructive to realize that the S&P 500 was 4.5% above where it was the day after the election and the ten-year Treasury bond yield was 4.28% vs 4.45% the day after the election. But this masks the volatility we have seen. Overall, we do believe the economy is slowing down at the margin and that the Federal Reserve is on a path to cut short-term interest rates further, but probably not until later in the year when there is more clarity on tariffs and potential inflation.
Economic Outlook – David Berson, Chief US Economist
The key points you should know:
- The outlook for the economy and financial markets is far more ill-defined than usual given the uncertainty surrounding tariffs.
- Despite this significant uncertainty, at mid-year the economy continued to grow, although the pace appears to be moderating.
- Inflation is also slowly moderating, but it remains above the Federal Reserve’s long-term goal of 2.0 percent. One of the greatest uncertainties going forward is whether tariffs will result in a one-time hike in prices or a longer-term increase in inflation.
- Markets look for modest Fed easing later this year, with additional easing in 2026.
- Despite the uncertainties, financial markets rallied into mid-year, with broad equity market averages at or near all-time highs.
A look back at the first half of the year – slower growth, lower inflation, and rising uncertainty.
Real GDP growth fell at an annualized pace of -0.5 percent in the first quarter, the first decline in three years. Does this drop imply that the economy was on the cusp of recession at the start of the year? The answer is unequivocally no. Worries about a sharp increase in tariff rates caused a surge in imports in order to beat those increases, and by the magic of national income accounting, this was a big enough negative to bring overall real GDP down. Other data certainly don’t support a downturn. Nonfarm payrolls, for example, averaged a monthly gain of about 130,000 over the January-June period, slower than the average from 2025, but far from a recessionary pace. Payroll gains even picked up a bit in the second quarter, averaging nearly 150,000 per month. Moreover, the unemployment rate fell in June to 4.1 percent, a very low level. The best measure of core economic growth (real final sales to private domestic purchasers, which excludes the volatility of trade) grew at an annualized pace of 1.9 percent for the first quarter. While this was a decided slowdown from last year’s nearly 3.0 percent increase, it is far from recessionary and is about equal to estimates of long-term trend growth. The Atlanta Fed’s GDPNow estimate for second quarter real GDP growth is 2.6 percent, helped by a much slower flow of imports trying to beat tariffs.
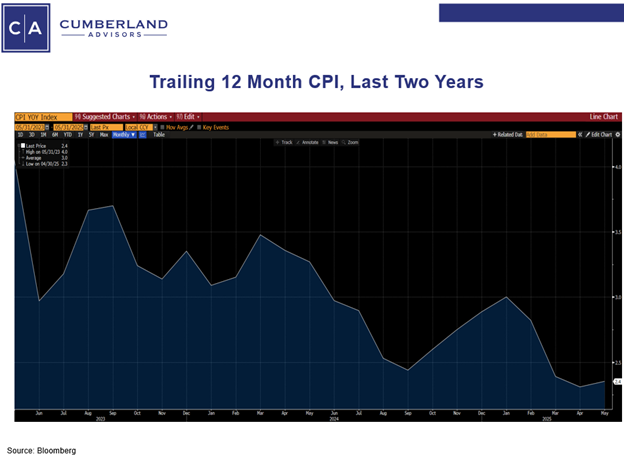
Inflation has edged lower over the first half of the year, but it remains modestly above the Fed’s long-term goal of 2.0 percent. The Fed’s preferred inflation measures are the very broad PCE price indices. Through May, the overall PCE price index was up by 2.3 percent from a year earlier, after having moved higher in the fourth quarter of last year and the first of this year. The 12-month trend core PCE price index (excluding the volatile food and energy components) was up by 2.7 percent in May. The more narrowly based consumer price index (CPI) trend rates are similar to the PCE measures. The 12-month trend rate for the overall CPI edged higher to 2.4 percent, while the core CPI was stable at 2.8 percent. We continue to view measures of central tendency (median or trimmed-mean) for inflation as better indicators of underlying inflation movements. The Cleveland Fed’s median CPI continues to trend lower, but in December the 12-month trend rate was still 3.5 percent. The 16-percent trimmed mean inflation measure came in at 3.0 percent. Overall, the data suggest that inflation declines have slowed and remain modestly above the Fed’s goal.
The Federal Reserve kept policy unchanged at the June FOMC meeting, with the federal funds rate target range remaining between 4.25-4.50 percent. The Separate Economic Projections (SEPs or the “dot plots”) showed a median expectation of two 25-basis-point cuts by year-end.
Longer-term interest rates were volatile over the quarter, moving after various tariff announcement – presumably in anticipation of Fed moves. After peaking at 4.79 percent in mid-January, the yield on the 10-year Treasury note plummeted to 4.01 percent immediately before President Trump announce his tariff program in early April. Those yields remained in a range of roughly 4.20-4.50 percent after that – ending the second quarter toward the bottom of that range at 4.24 percent.
Despite tariff turmoil, concerns about a recession, wars in Ukraine and the Middle East (including the US bombing of Iranian nuclear sites), and worries about coming record budget deficits, the actual solid economy and continued strong corporate earnings boosted equity markets. The S&P 500 Index, for example, climbed to a record closing level of 6279 on July 3 – up by 6.7 percent over the first half of the year and by 13.4 percent from a year earlier.
The outlook for the second half of 2025 – far less certain than usual, given tariff uncertainty.
Will tariffs eventually be broadly or narrowly implemented? What will the final tariff rates be? Which countries will sign new trade agreements with the US and which will not and so face even higher rates? When will tariffs finally be implemented? Will other nations respond by raising tariffs on U.S. goods and services? And perhaps most importantly – will tariffs cause a one-time increase in prices or will they be the start of a longer-term inflationary pulse? A lot of questions, but still not much clarity – and the answers to these tariff questions will be key determinants of the outlook for the economy and inflation. Broadly speaking, tariffs are a negative supply shock that increases prices and reduces activity, so we know directionally where things will go.
The passage of the “One Big Beautiful Bill Act” (OBBBA) would normally help to boost economic activity in the second half of the year. (To be sure, there are long-term negatives with respect to higher budget deficits coming from OBBBA, but those should be less apparent in the near term.) But combining the likely tariff impacts with OBBBA should mean that growth will be slower. Enough to cause a recession? Probably not, but that depends on the final answers to the tariff questions raised above. On balance, we expect a modest slowing in growth over the remainder of the year, probably to a 1-2 percent annualized rate range for real GDP growth.
We know that tariffs will boost prices, but it’s unclear by how much. Will firms decide to reduce profit margins? This clearly would not be good for earnings and stock prices. Will firms decide to move more production to the US? If firms could produce at lower cost in the US they would do so now, suggesting higher production costs resulting in some combination of higher prices and lower profits. Will firms simply pass along the tariffs in the form of higher prices? In reality, different firms will make different choices. But at least some firms will raise prices. This one-time increase in prices is not inflation (which is an ongoing increase in prices on average), but it could turn into an inflationary pulse. Higher upstream prices could result in higher downstream prices. Additionally, workers could respond to the initial rise in prices by demanding higher wages – perhaps spurring a wage-price spiral. Or the Fed could respond to the likely slower growth in the economy by easing monetary policy – monetizing the tariff price pulse (not to mention the fiscal expansion from OBBBA). Our best guess, given the great uncertainties surrounding tariffs, is that inflation will move up modestly in the second half of the year – although this uptick should be offset to some extent by slower growth.
Although President Trump has called for significant easing by the Federal Reserve immediately, the inflation unknowns will probably keep the Fed on the sidelines for now. Still, unless inflation moves sharply higher, slower economic growth is expected to get the Fed to start easing by the September FOMC meeting. Financial markets expect two to three easing moves over the remainder of this year (for a total reduction of 50-75 basis points), with more next year if growth slows further and inflation moves lower again. This is probably a reasonable projection given the high levels of uncertainty.
As long as the tariff-caused inflation pulse is modest and not expected to last long, longer-term interest rates should respond to Fed easing later this year (as well as expectations for easing in 2026) by moving lower. But federal budget deficit concerns could counter some of this decline in longer-term rates – with the result being a steepening of the yield curve as longer-term rates move down by much less than shorter-term rates do.
We have yet to see much impact from President Trump’s regulatory agenda and the broad implementation of artificial intelligence (AI). Both of these should act as positive supply shocks – helping to boost growth and reduce prices. But these are likely to have longer-term impacts rather than immediate impacts on the economy and inflation.
Total Return Gov/Credit – Dan Himelberger, Portfolio Manager & Fixed Income Analyst
Treasury Movements
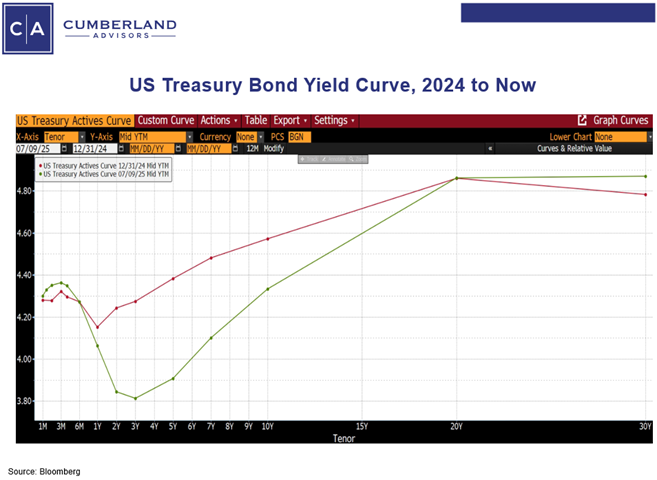
The US Treasury market experienced significant volatility in the first half of 2025, driven by evolving trade policies, fiscal concerns, and shifting economic projections. This led to a continuation of the steepening trend observed in 2024, with short to intermediate tenors outperforming long-dated Treasuries. As illustrated in the chart below, the most significant decline occurred in the 3–5-year segment, which fell by approximately 58 basis points, while the 30-year Treasury ended the first six months of the year nearly unchanged. The complete movement of the Treasury curve can be seen below.
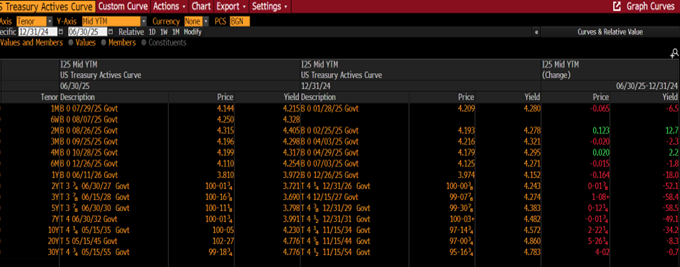
Source: Bloomberg
Spread Movements
Investment-grade corporate and taxable municipal bond spreads also saw increased volatility during the first half of the year, with corporates experiencing more significant fluctuations. The spread on the Bloomberg US Corporate Bond Index rose by 5 basis points, ending the first half at +83, although it peaked at +119 in April. Meanwhile, the spread on the Bloomberg Taxable Muni US AGG Index increased by 11 basis points, concluding the first half at +85, but it only surged to +97 at its peak in April. As noted in our previous reports, we believe that the potential for further gains in these spread products has largely been realized. As a result, we began decreasing our overweight position in these securities while simultaneously increasing our allocation to Treasuries throughout the past year, which has proven advantageous. We continue to regard these spreads as tight and have not yet begun to shift portfolios back to a more spread product exposure. We continue to closely monitor the situation for opportunities to adjust our allocations within these asset classes.
Outlook
Going into the second half 2025, we will diligently observe economic indicators, placing particular emphasis on inflation and the policies of the Trump administration. Our current forecast suggests that the 10-year Treasury will fluctuate within a range of 4.00% to 4.50%, with a potential risk of reaching 5.00%. The broad range reflects the uncertainty surrounding future policies and the heightened volatility that the market has been experiencing. Our objective will be to sustain elevated liquidity levels, which will afford us greater flexibility in making strategic adjustments moving forward. While we will adopt a conservative stance on credit, we will also remain vigilant in identifying and seizing attractive investment opportunities as they arise.
Tax-Free Municipal Bonds – John Mousseau, Vice Chairman & Chief Investment Officer
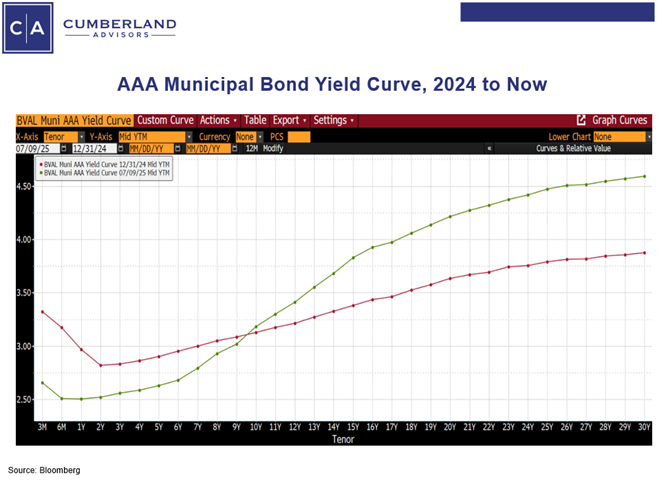
As we head into the second half of 2025, the municipal bond market has moved through a number of hurdles it faced during the first half of this year. The first two charts below show the municipal bond AAA yields and the US Treasury yields from the end of last year, the end of the first quarter, and the end of the second quarter. We have also included graphs showing the muni AAA yield curve and US Treasury yield curve at year end and now.
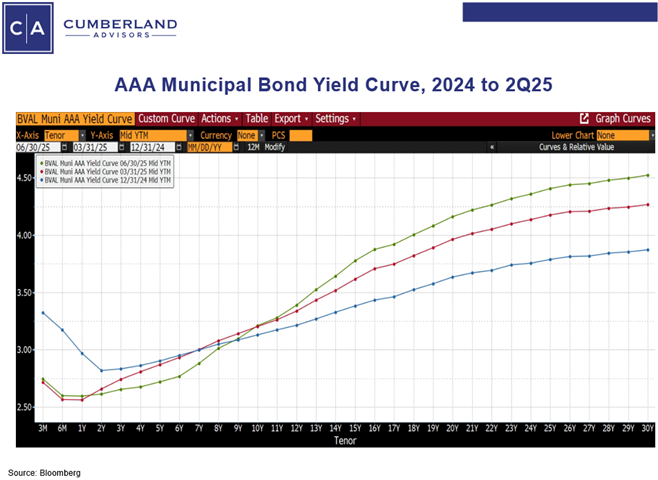
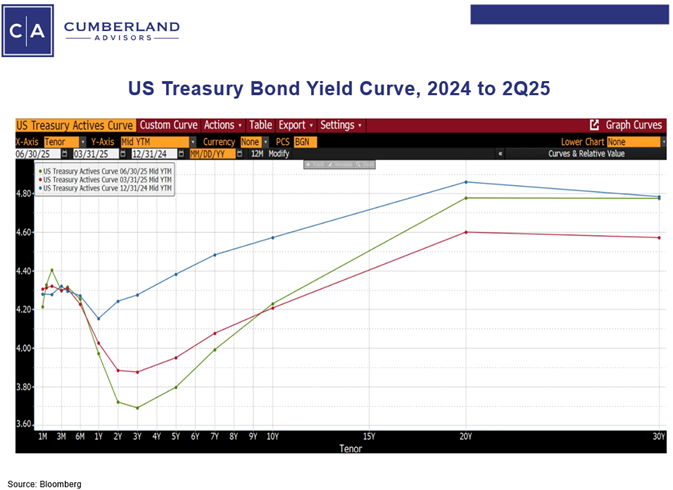
We can see, particularly in munis, the rise in longer-term yields and the drop in shorter-term yields. The longer end of the muni market was buffeted with uncertainty. In March there was the ongoing talk about the possible taxation of municipal bonds – both proactively on newly issued bonds as well as on all existing municipal bonds. In addition, there was discussion about possibly limiting the benefit of municipal bonds’ federal tax exemption to a 28% cap rate. In the end none of this happened. Our view through all of it was that, as there was a reduction in Federal government activities, it would be very disingenuous of Congress to ask state and local governments to do more and then take away their ability to finance those activities plus other infrastructure at an advantageous rate. In the end, the tax bill that the House and Senate passed did not include any negative changes to the municipal market. It also certainly got a boost from French Hill, Chair of the House Financial Services Committee, who urged House Ways and Means to leave the muni market alone because of its importance in financing infrastructure.
The tariff talks of early April, combined with President Trump’s talk about replacing Jay Powell, produced enhanced volatility in the Treasury market, which hurt the ability of municipal dealers to hedge either new issues or secondary issues; and hence the muni market faded quickly as dealers priced new issues cheaply and dropped their bid on secondary issues. The market has been repairing since early spring. Lately it has met with a supply surge (running 32% ahead of last year and the end of the second quarter) with good flows into municipal bond funds, ETFs, and private accounts. The supply surge picked up after the market achieved some clarity on the taxation issues. With longer-term tax-fee high grade municipal yields near 5% or higher, we believe the long maturity end of the municipal bond market is mispriced too cheaply.
Our view of the Federal Reserve is that they will be patient in lowering short-term rates. This is because of the uncertainty over the final level of tariffs as well as their implementation. The uncertainty on these issues suggests more “waiting time” on the part of the Fed. There are certainly voices at the Fed who are calling for rate cuts earlier. Our view is that the economy is slowing down, and this is across many different variables including higher credit card delinquencies, more student loan debt in arrears, higher subprime auto loan delinquencies, continuing rises in continuing jobless claims, much lower quits rates among jobholders, and generally lower “soft” sentiment indicators.
The Fed is waiting to see where tariff impacts will be (and June CPI and PPI will be the first indicators). However, inflation has come down over the first half of the year, falling from 2.9% at year end to 2.4% now. It will rise with tariffs, but we believe this will be a one-time increase and then resume its downward trend.
It is important to remember that US yields are generally higher than yields around the world.
Here is the ten-year US Treasury yield and other countries’ Ten-year yields compared to their trailing inflation numbers as of the end of the quarter.
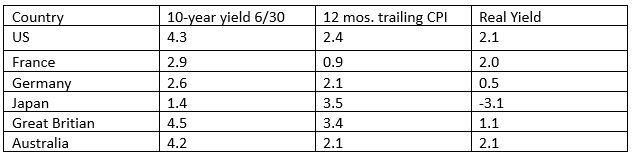
When viewed in this light we think that the trend over time should be to lower rates, and we are looking for a range of 4.0-4.5% on the US ten-year Treasury.
Municipal Credit Outlook – Patricia Healy, Senior Vice President of Research & Portfolio Manager
In the second half of 2025 we expect to see continued budgetary discipline by municipalities; however, we expect some reductions in the reserves that have been built up over the past few years. Reserves and/or rainy-day funds are held to provide flexibility for unseen events and less-positive economic times. We do not expect many rating changes for reserve reductions as long as the municipality has a clear plan for keeping reserves at a healthy level.
Many states have reduced revenue projections from lowered tax rates or economic weakness, and the changes to Medicaid and other federal funding as well as the effect of tariffs will challenge management over the remainder of the year and into the future. However, S&P estimates, based on states’ 2026 budgeted reserve positions, that 47 states are able to withstand a 5% decline in revenue and 34 can withstand more than a 10% decline. The average decline in revenue for states was 6% during the pandemic. California, Washington and Illinois are exceptions, able to withstand only a 0% to 5% decline in revenue.
States that grapple with challenges could alter funding to municipalities, as we have seen in past recessions. But as we noted earlier, municipalities have improved budgeting and reserve positions, too. The economy is performing better than was expected earlier in the year, when many were projecting a recession sparked by tariffs. However, there are signs of weakening, and how that affects municipal revenue will be important, as will the effect of federal funding changes.
Many sectors have negative outlooks related to tariffs (ports) and supply chain difficulties (infrastructure and utilities), rising costs and changes in funding (healthcare), the downturn in travel (airports), and demographic changes (school districts and higher education). Some entities within a sector will be challenged, and others will not. For example, some municipal utilities, healthcare organizations, and airports were recently upgraded.
Hurricane season runs through November 30th, with an above-average forecast for storms; and more extreme weather events are unfortunately likely to continue and challenge municipalities and could cause rating changes. Historically, after a disaster the economy of the affected municipality or region would rebound due to rebuilding, despite the devastation. Potential FEMA changes and local requirements of rebuilding with resiliency may make it more expensive; however, they could also make a municipality more able to withstand storms.
Will the second half of the year see more downgrades than upgrades, after many years of upgrades surpassing downgrades? We think the gap between them may narrow but not reverse with challenges, because of improved budgeting, generally good reserve levels, and a still-good economy.
Links to other websites or electronic media controlled or offered by Third-Parties (non-affiliates of Cumberland Advisors) are provided only as a reference and courtesy to our users. Cumberland Advisors has no control over such websites, does not recommend or endorse any opinions, ideas, products, information, or content of such sites, and makes no warranties as to the accuracy, completeness, reliability or suitability of their content. Cumberland Advisors hereby disclaims liability for any information, materials, products or services posted or offered at any of the Third-Party websites. The Third-Party may have a privacy and/or security policy different from that of Cumberland Advisors. Therefore, please refer to the specific privacy and security policies of the Third-Party when accessing their websites.
Sign up for our FREE Cumberland Market Commentaries
Cumberland Advisors Market Commentaries offer insights and analysis on upcoming, important economic issues that potentially impact global financial markets. Our team shares their thinking on global economic developments, market news and other factors that often influence investment opportunities and strategies.
