The US stock market kicked off the second quarter with new all-time highs above 4,000 on the S&P 500. Meanwhile, the volatility index, VIX, has closed below 20 for five consecutive days for the first time in 13 months. With the strong rally in the equity market, is this the beginning of the VIX’s returning to the lower bound, as we had before the COVID selloff?
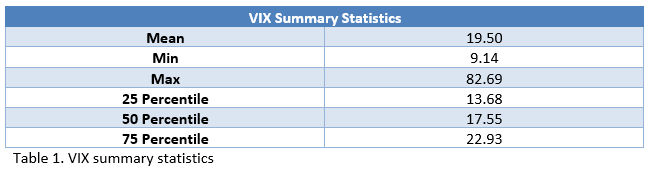
To put everything in perspective, Table 1 shows the summary statistics of VIX. The average of the VIX since 1990 has been 19.50. As the percentile table shows, VIX is unevenly distributed towards the lower half, with the 50th percentile being 17.55. However, VIX has averaged 29.62 since March 2020. That’s above the 90th percentile (28.90) – an extremely high average for any rolling 13 months. Since this extreme level is unlikely to be sustainable for a prolonged period, we can expect the VIX to pull back this year. But does this mean VIX will stay low? Let’s take a look from a different perspective.
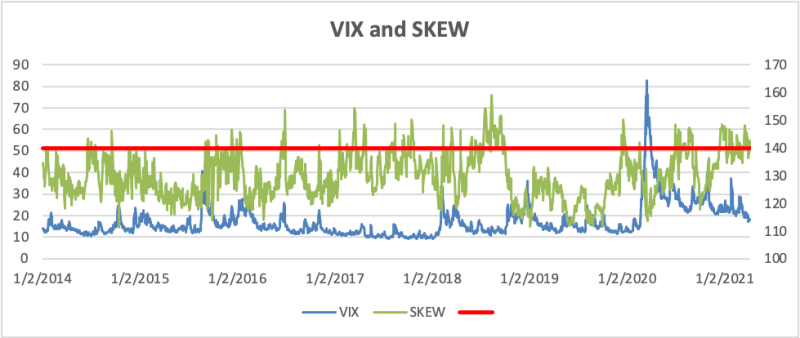
Note that the SKEW Index has closed above 140 for 49 out of the past 76 sessions since mid-December. This has been the longest 140+ run in SKEW’s history. Hence, even though the VIX appears to be trying to return to its normal level below 20, we should still be prepared for VIX to rise back into the 20s or even the 30s this year.
Leo Chen, Ph.D.
Portfolio Manager and Quantitative Strategist
Email | Bio
*Data from Bloomberg.
Links to other websites or electronic media controlled or offered by Third-Parties (non-affiliates of Cumberland Advisors) are provided only as a reference and courtesy to our users. Cumberland Advisors has no control over such websites, does not recommend or endorse any opinions, ideas, products, information, or content of such sites, and makes no warranties as to the accuracy, completeness, reliability or suitability of their content. Cumberland Advisors hereby disclaims liability for any information, materials, products or services posted or offered at any of the Third-Party websites. The Third-Party may have a privacy and/or security policy different from that of Cumberland Advisors. Therefore, please refer to the specific privacy and security policies of the Third-Party when accessing their websites.
Sign up for our FREE Cumberland Market Commentaries Cumberland Advisors Market Commentaries offer insights and analysis on upcoming, important economic issues that potentially impact global financial markets. Our team shares their thinking on global economic developments, market news and other factors that often influence investment opportunities and strategies.
