President Warren G. Harding made the term “return to normalcy” famous in the 1920 presidential election when he used the phrase as a campaign theme, promising to bring America back to what it was prior to World War I and the Spanish Flu pandemic, which gripped the nation and the world from 1918 to early 1920. Some people said that Harding should have used the word normality instead of normalcy; but Harding, a former newspaper editor, stuck to normalcy; and the catchphrase entered the pantheon of American political slogans.

https://www.britannica.com/biography/Warren-G-Harding
Today, as we reach higher levels of vaccinations, with three vaccines now available and possibly more coming, the markets have started returning to normal. Of course we are not seeing the trend just in financial markets but in everyday life, too, with the re-opening of the economy (admittedly at different paces in different parts of the country); and we view it in restaurants and in limited attendance now at sporting events, church services, etc. More important is the “forward” pace of economic activity, where people are booking travel plans for later in the year and into 2022. If you are skeptical, try booking a cruise for 2022.
How is this “return to normalcy” reflected in the bond market? We can look at this in several different ways.
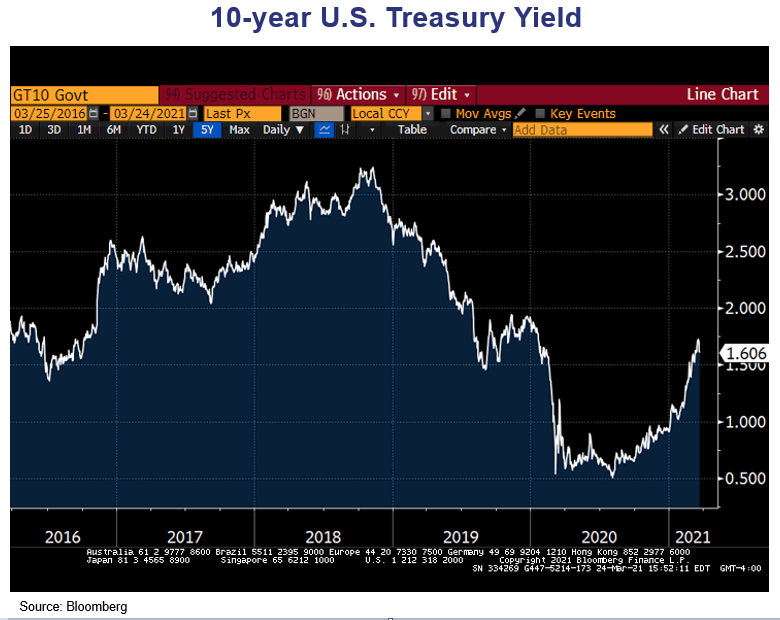
Here is the nominal yield on the 10-year US Treasury bond yield going back a couple of years. At over 1.6%, the yield is back to where it was before the country slid into the pandemic in March of 2020. We can see the rise since the summer of 2020, when the yield stood at 0.5% in August. We see the rise continue through the fall, anticipating a Democratic win in the presidential election (and discounting more stimulus, which we now have). Then we see a resumption of the rise in yields after the Georgia Senate election in January, which meant that the Senate would be in Democratic hands, along with the White House and the House of Representatives. (See Cumberland Advisors Market Commentary, “The Blue Wave and the Bond Markets,” at https://www.cumber.com/cumberland-advisors-market-commentary-the-blue-wave-and-the-bond-markets/.) Some publications have characterized the rise as a “bond market rout.” We would beg to differ. We think this is a return to where we were prior to the pandemic. From a reference standpoint, the 10-year Treasury yield stood at 1.9% at the START of 2020 and the 30-year Treasury yield stood at 2.4% – just about where the 30-year yield is now. So, this return to normalcy is still in play, but we are clearly back to where we were pre-pandemic.
What about “yield curves?
Let’s look at the steepness of the yield curve.
We know that the flattening of the yield curve in 2019 was an aberration. Normal flattening of yield curves occurs when yields move higher in the short end as a result of the Federal Reserve’s hiking short-term rates. As we have discussed, flat yield curves don’t “forecast” recessions; they help CAUSE them: As this spread disappears, banks become less profitable in borrowing short term and lending long term; and they react by rationing out credit to their best (read, most creditworthy) customers, and then a credit crunch begins. In 2019, yields FELL on the long end rather than rose on the short end as US long bond yields went down in sympathy with the low rates in Europe and Japan.
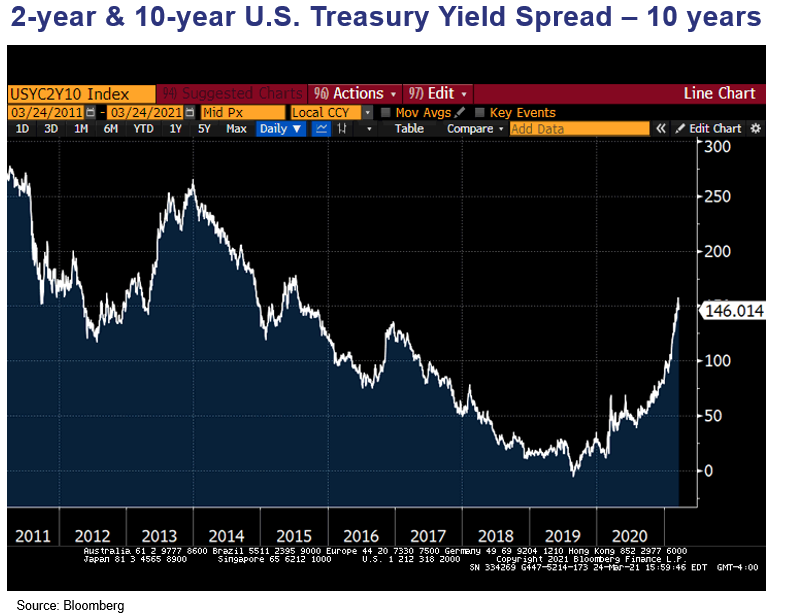
Since last summer, the spread between 2-year and 10-year US Treasuries has climbed to its highest point since 2015. This steepness we think of as a forward-looking indicator that the market believes the economy will do well going forward, with growth perhaps bringing some incremental inflation, and, further, that bond investors want to be paid for the risk of owning longer securities. We can also measure it in these terms: The current 145 basis points of spread between 2 years and 10 years represents 91% of the currently available 10-year bond yield 1.60%. Compare this to 2015, when the same spread was in place when the 10-year bond was 2.5%. Another way of looking at it is that, at today’s interest rate levels, the steepness is forecasting a more vigorous economy than the yield curve did in 2015. We know all the reasons – return from the lockdown; the spending down of balances from the high savings rate; and a return, eventually, to travel, conventions, restaurants, etc.
What about “real yields”?
The real yield is the difference between what you earn in a bond yield less the rate of inflation. At Cumberland in most of our quantitative work we use the 10-year US Treasury yield less the headline CPI number. With the price of oil as volatile as it has been during the pandemic (especially early on), we are going to look at the real yield using the 10-year Treasury and the CORE Consumer Price Index on a trailing 12-month basis.
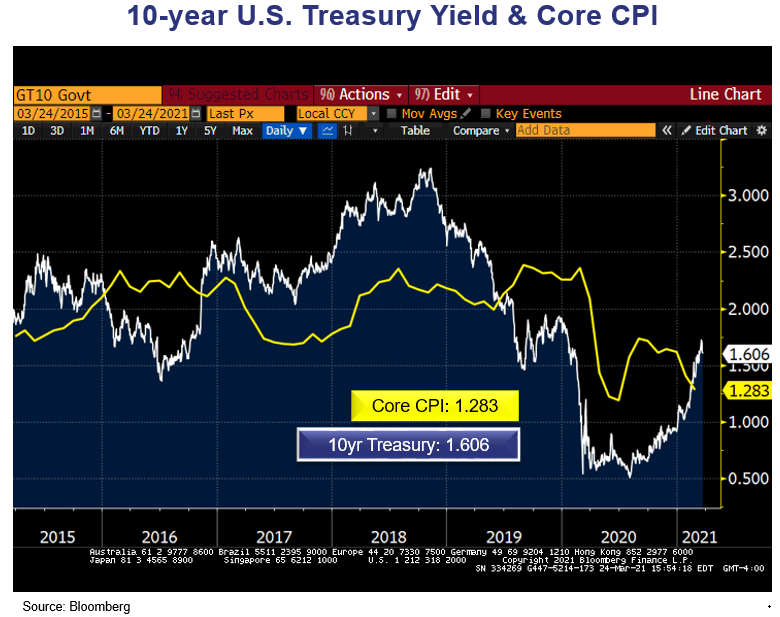
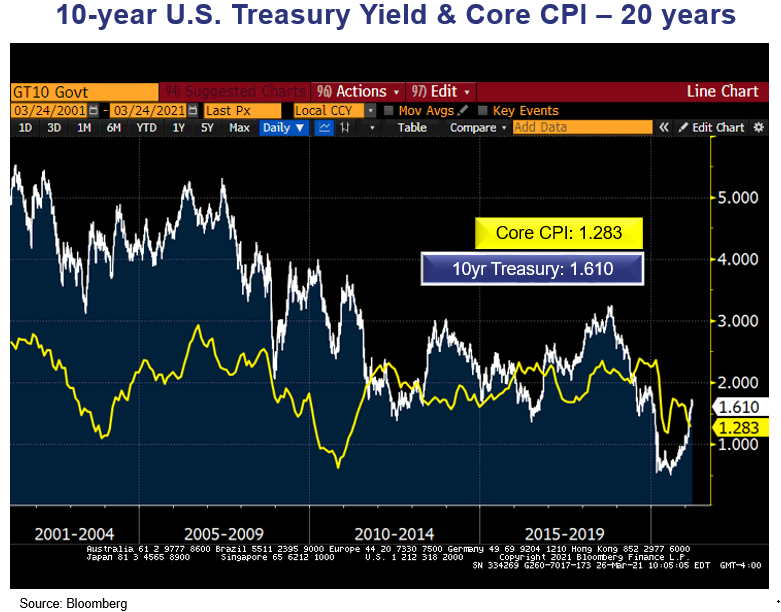
We see that the NORMAL course of real yields is to be positive over the long term. In the past few years, the two periods of NEGATIVE real yields occurred in 2016, when yields dropped in response to the affirmative Brexit vote in Britain that June. We see that inflation did not drop, but yields did. Yields started to work their way back up and then picked up significantly after President Trump was elected in 2016. Yields then dropped through 2019 as US yields (in the longer end) tried to “catch up” with the lower yields that were occurring in Europe and Japan. And then, of course, we had the drop in both inflation AND interest rates as COVID-19 hit over a year ago. The turnaround in real yields since August of 2020 is strictly a “return to normalcy” in yields. We expect trailing inflation in core CPI to pick up soon as last year’s downdrafts of March and April are replaced by more buoyant inflation this year. But real yields have moved back into positive territory, and this is much more the normal situation.
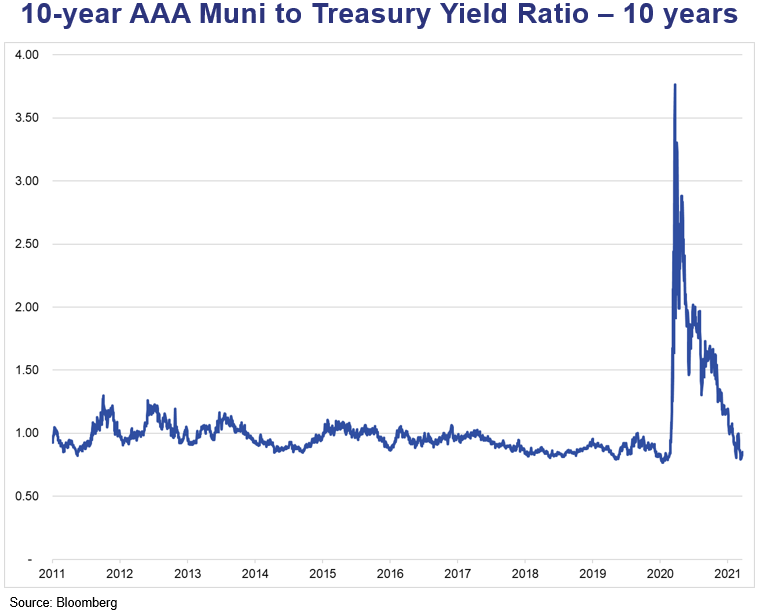
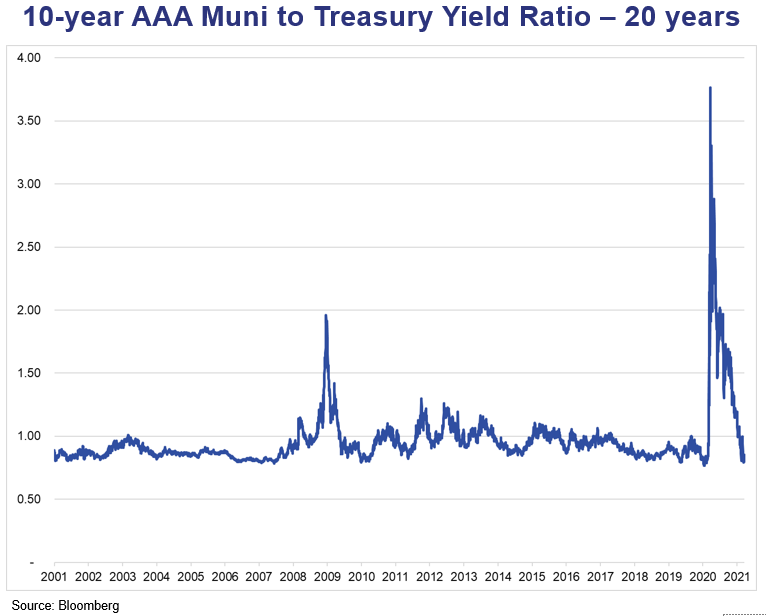
What about the relationship between tax-free bond yields and US Treasury yields?
The two charts below show the yield ratio between AAA tax-free 10-year bond yields and 10-year US Treasury yield curves recently and over the longer term. We can see the two big “blow-ups” that occurred in the post-Lehman period of 2008–2009 during the Great Recession and of course during the March–April period of COVID last year. In those cases, tax-free bonds represented EXTRAORDINARY values, and of course both events came about because of the hemorrhaging of bond funds during those periods. In 2008–09 the cause was a combination of liquidity concerns and some credit concern post-Lehman. In 2020, it was almost entirely liquidity concerns, as all asset classes (except Treasuries) were being pummeled. We began to see this ratio return to normal, finally, in the fall of 2020 and actually go to extreme valuations in term of low ratios this January, when the ratio went to such low levels that, in theory, the US Treasury was worth more if you paid the tax! We have never seen that during recent history (say, the last 50 years). Of course, the other way to process that anomaly is that investors are moving into the tax-free bond market expecting that marginal federal tax rates will be raised by the Biden administration – and indeed we are hearing rumblings about that prospect now.
So, in summary, we are “returning to normalcy” on multiple counts: in terms of overall yield, in terms of the STEEPNESS of the yield curves, in terms of getting back to positive REAL yields, and in terms of positive real yields and how tax-free bonds are being priced relative to Treasuries. We think that as we get more people vaccinated, the degree of normalcy increases.
We hope everyone is on track to register and get their vaccine. We note that while President Harding died suddenly in 1923 from cardiac arrest brought on by pneumonia, the country continued to return to normalcy under President Calvin Coolidge; and the “Roaring 20s” were born.
John R. Mousseau, CFA
President, Chief Executive Officer,
and Director of Fixed Income
Email | Bio
Links to other websites or electronic media controlled or offered by Third-Parties (non-affiliates of Cumberland Advisors) are provided only as a reference and courtesy to our users. Cumberland Advisors has no control over such websites, does not recommend or endorse any opinions, ideas, products, information, or content of such sites, and makes no warranties as to the accuracy, completeness, reliability or suitability of their content. Cumberland Advisors hereby disclaims liability for any information, materials, products or services posted or offered at any of the Third-Party websites. The Third-Party may have a privacy and/or security policy different from that of Cumberland Advisors. Therefore, please refer to the specific privacy and security policies of the Third-Party when accessing their websites.
Sign up for our FREE Cumberland Market Commentaries
Cumberland Advisors Market Commentaries offer insights and analysis on upcoming, important economic issues that potentially impact global financial markets. Our team shares their thinking on global economic developments, market news and other factors that often influence investment opportunities and strategies.
