Friday’s GDP release showing growth at 4.1% is clearly positive news. Consumer spending contributed 2.7 percentage points to growth, followed by fixed investment (0.94 percentage point largely offset by a negative 1.0 percentage point contribution from inventories) and a 1.06 percentage point contribution from net exports. If we factor this growth figure together with a PCE inflation now at 2.3%, a strong job market (230K jobs were created in June), and unemployment at 4%, the FOMC now appears to have a strong case to make another rate hike, even though the next meeting, on July 31–August 1, is not one where new projections will be offered or a press conference scheduled.
Naysayers will argue that this growth rate can’t continue and that 4.1% is clearly above potential. For example, exports are up, and some have suggested that the surge has occurred because companies anticipate looming tariffs. The administration, on the other hand, is arguing that we haven’t seen anything yet when it comes to growth. Well, the question is, can 4.1% be repeated the next couple of quarters? First, let’s look at a bit of history. The chart below shows the quarterly real GDP growth rate (annualized) since 2005 – before the financial crisis and the period following the crisis, when we have seen slow productivity growth.
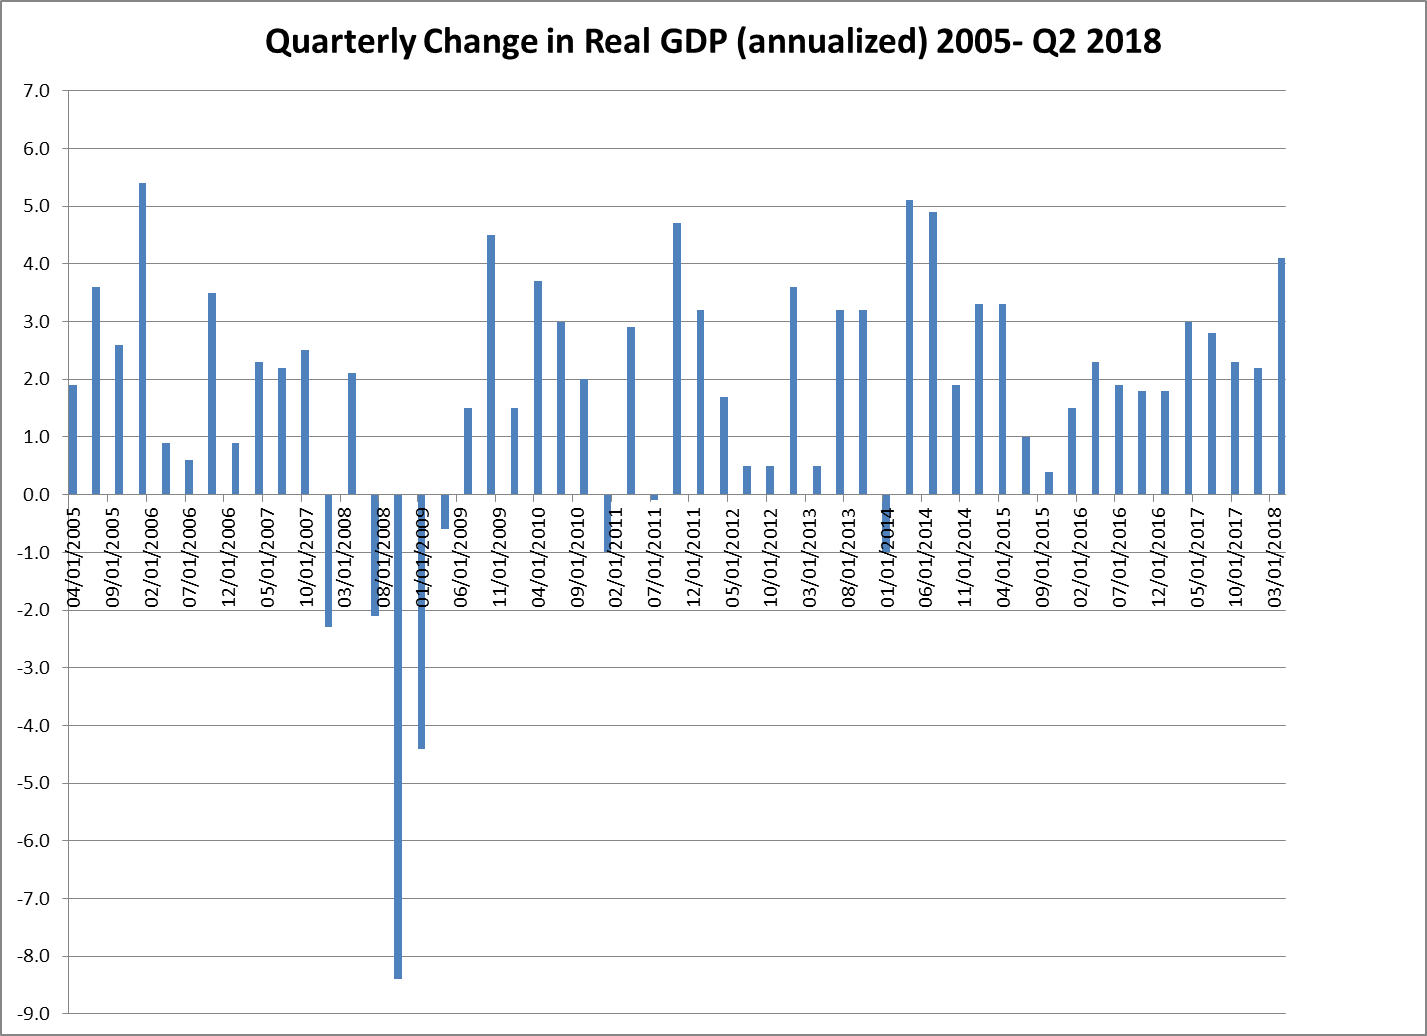
Over that period there have only been 6 out of 50 quarters where growth has been over 4% (four at slightly over 4% and two at 5% or more). In nearly each case, the following quarter was in many instances about 2%, and growth continued to stay well below 4% for many quarters thereafter. Only one exception exists when growth was over 5% (Q1 2014) followed by growth over 4% (Q2 2014) the next quarter.
One of the reasons for a reduction in the rate of growth following a strong quarter during the 2005-2018 Q2 period is the fact that potential growth is actually much less and 4%, and people argue that this remains the case going forward. The Congressional Budget Office, for example, puts potential growth at 2.3%.
How might we rationalize that number? The two key determinants of potential GDP growth are the rate of growth of productivity and rate of growth of the labor force. Abstracting from sophisticated analytical techniques, productivity growth from 2007 through Q3 2016 was about 1.1% (1). BLS employment projections suggest that the labor force will grow about 0.6% over the next 10 years or so. Add those two numbers together, and we get a sustainable growth rate of slightly less than 2%. Now, if the positive economy brings more people into the labor force – i.e., the participation rate increases – and the investment stimulated by the tax cut continues, then we may see potential GDP about where the CBO has it. But the prospect for large, sustainable increases in GDP growth is at this point problematic.
So, while the Q2 GDP number is extraordinary and the economy is basically strong, we are not likely to see a continuation of such robust growth, especially if the tariff and trade wars continue. Furthermore, the FOMC is going to be focused on inflation, which is now running 16% above its 2% target rate.
Robert Eisenbeis, Ph.D.
Vice Chairman & Chief Monetary Economist
Email | Bio
Links to other websites or electronic media controlled or offered by Third-Parties (non-affiliates of Cumberland Advisors) are provided only as a reference and courtesy to our users. Cumberland Advisors has no control over such websites, does not recommend or endorse any opinions, ideas, products, information, or content of such sites, and makes no warranties as to the accuracy, completeness, reliability or suitability of their content. Cumberland Advisors hereby disclaims liability for any information, materials, products or services posted or offered at any of the Third-Party websites. The Third-Party may have a privacy and/or security policy different from that of Cumberland Advisors. Therefore, please refer to the specific privacy and security policies of the Third-Party when accessing their websites.
Sign up for our FREE Cumberland Market Commentaries
Cumberland Advisors Market Commentaries offer insights and analysis on upcoming, important economic issues that potentially impact global financial markets. Our team shares their thinking on global economic developments, market news and other factors that often influence investment opportunities and strategies.
