Brent Donnelly, president of Spectra Markets, and a Camp Kotok attendee, sent along the following piece with the note, “Some alarming charts for you today. Keep an open mind on the US economy in 2022.”

I read Brent’s very insightful AM/FX daily upon arrival, and you may want to do so, too. Here’s how: https://www.spectramarkets.com/subscribe/.
Something weird is going on
by Brent Donnelly
Original Publication Date: Jan 19, 2022
For those of you that don’t work with economic data much, here is a chart to give you a sense of how bonkers the last two years have been.
US Retail Sales, Control Group, MoM change
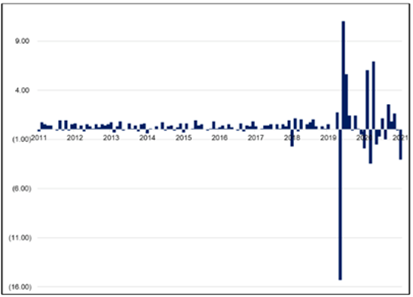
There are ways of fixing the problem, I just thought I would share this with you because it gives you a sense of the Hunga Tonga magnitude of the regime shift in the economy. We just experienced an abrupt change going from years of secular stagnation and the death of economic volatility straight into the craziest economic volatility of our lives. Much as we need to chop 2008 out of all the financial market time series data because of its volatility, we need to chop 2020 out of all the economic time series.
I was looking at this because after yesterday’s huge miss in Retail Sales and then the Empire State Index, I am starting to wonder if there is something to worry about in the US. The most forward-looking component of the survey data tends to be the New Orders Index. Here is Empire State New Orders back to 2002:
Empire State Index, New Orders
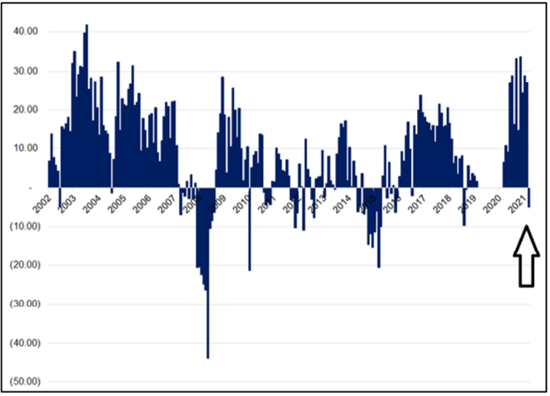
The figure was -5.0 this month vs. +27.0 last month. That is a rapid drop. Here is the same data, but using the change in Empire State New Orders, instead of the number itself.
Empire State Index, New Orders (current month change vs. 3-month prior average)
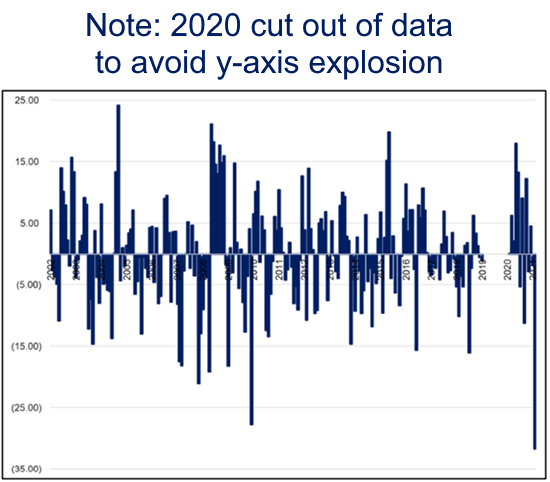
The last time we saw this big of a drop in New Orders was when Portugal and Ireland were getting bailed out in the heat of the Eurozone crisis (November 2011). Are these huge drops in Empire and Retail Sales simply a product of elevated economic volatility? Or is something more nefarious going on?
I have trouble envisioning full on economic weakness in the USA with claims around 200k and the UR below 4.0%. My inclination is to believe that these are more noise than signal, especially with omicron raging. However, there were some compelling reasons to believe a cooldown from overheating conditions in the US economy was possible this year, and a lot of smart people I talk to believe we cool significantly on the back of:
• Fiscal drag https://www.newsnationnow.com/us-news/will-you-still-receive-a-child-tax-credit-payment/
• Consumer retrenchment due to high inflation and dwindling savings
• Labor supply shortages
• Supply chain bottlenecks
• Giveback as everyone panic bought in October ahead of Christmas
It’s way too early to panic, but these two recent data points are hard to ignore as we begin the year. If you really wanted to be worried, you could add the small uptick in Initial Claims to your list of concerns. That series is noisy, though. Going forward, regional surveys and ISM will be of particular interest. We get Philly tomorrow and Chicago, Richmond and FOMC next week. Given Fed pricing, the impact of a further run of weak data could be epic.
Speaking of reasons to be worried (!)
Someone noted to me that the recent combination of moves in markets is rather odd. Stocks down, oil up, rates up is not a trifecta that hits very often. In fact, it barely ever hits. I looked at the data back to 1983 and filtered for the following: (Past 10 days: US yields up 10bps or more, Oil up 10% or more, SPX down 4% or more). 30 days qualify, out of about 10,000, and they are all clustered. Brace yourself, the chart is spooky.
US yields up >10bps, Oil up >10%,
AND ... SPX down 4% or more. In past 10 days.
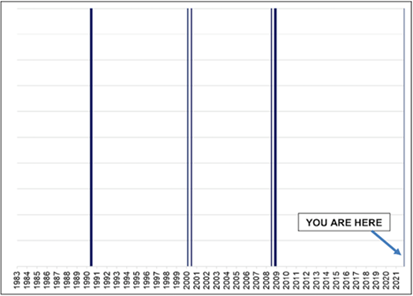
There is no data mining or overfitting here. I just looked at the last ten days of moves, filtered for similar and got this. Most people probably know this, but in case you are young or new to finance... The last three recessions before COVID were 1990, 2001 and 2008. Interesting in the context of the recent mini-run of horrendous data and the end of the child tax credit.
If the data rolls over, my gold trade is dead. No call to action today other than: be vigilant on the economic data.
Something weird is going on.
Feedback always welcome. Have a wordy day.
good luck ⇅ be nimble
We thank Brent for giving us permission to share his missive with our readers. -David
Links to other websites or electronic media controlled or offered by Third-Parties (non-affiliates of Cumberland Advisors) are provided only as a reference and courtesy to our users. Cumberland Advisors has no control over such websites, does not recommend or endorse any opinions, ideas, products, information, or content of such sites, and makes no warranties as to the accuracy, completeness, reliability or suitability of their content. Cumberland Advisors hereby disclaims liability for any information, materials, products or services posted or offered at any of the Third-Party websites. The Third-Party may have a privacy and/or security policy different from that of Cumberland Advisors. Therefore, please refer to the specific privacy and security policies of the Third-Party when accessing their websites.
Cumberland Advisors Market Commentaries offer insights and analysis on upcoming, important economic issues that potentially impact global financial markets. Our team shares their thinking on global economic developments, market news and other factors that often influence investment opportunities and strategies.
