We were working on the issue of corporate profits and what is the widest-ever statistical discrepancy in the GDP data. Lo and behold! In comes my friend Michael Drury with an excellent analysis and graphic depiction of the problem. Mike graciously gave permission for us to reproduce his entire missive. You will find it below.

What’s critical for stock market investors is that the profit share of GDP is where corporate earnings originate. No profits, no earnings. A growing profit share is a harbinger of a growing trend in earnings. The reverse is also true. But what do we do when the BEA data series has lost its alignment and the statistical discrepancy between two methodologies is the widest seen in a half century? As Shakespeare wrote in Hamlet’s soliloquy, “Aye, there’s the rub.”
We are tracking earnings very closely. For the third quarter of this year, the S&P 500 collectively earned about $54. Stock prices have been rising based on that number’s sequential growing at a robust rate. For the last five quarters we have been watching upward revisions taking place in earnings estimates as the US economy has recovered from the March–April 2020 decline of Great Depression era proportions.
Now the issue is, what happens next?
True confession: we really don’t know. And Omicron, which was expected to be named “Nu” for a few hours until WHO named it Omicron instead, has administered a shock the size of which is still to be determined as we learn more about what to expect.
Here’s a snippet. Hat tip to Paul Schulte in Singapore. “The news from South African hospitals is that 1) cases of ICU and oxygenation were up four fold from a few weeks ago. From about 150 to about 650. Bad news. But the good news is that ONE HUNDRED PERCENT OF THOSE IN ICU OR ON OXYGEN for the new variant were unvaccinated or had a single shot. The German Minister of Health put it well. ‘you can get vaccinated. Or you can get sick. Or you can die. You decide.’“
Here’s Michael Drury on the “statistical discrepancy”. We thank him for this excellent analysis of the issue.
Weekly Economic Update
Michael Drury, Chief Economist
McVean Trading and Investments LLC
(https://www.mcvean.com)
Volume 100, Number 8
November 26, 2021
We hope you all had a wonderful Thanksgiving – because Black Friday was a real downer, with the announcement of a new COVID variant sparking a hectic run to safety in the financial markets. Crude oil crashed over ten dollars, to $68.15, as options expiration compounded the sell-off. Ten-year notes plunged 16 basis points to 1.47% and the S&P500 fell 106 points, or 2.27%. The US holiday thinned trading, but the sensitivity of global markets to bad news illustrates the dubious underpinnings of asset prices. Renewed shutdowns in Europe and the rising spread of the virus in the north of America had already raised concerns. The potential for a variant which may evade vaccinations – even in the heavily vaccinated developed nations – raised the specter of a return to widespread quarantines and their negative consequences for growth.
Ahead of Thanksgiving, a deluge of data painted a mixed picture of the economy, with real consumption appearing much stronger than expected, while capital spending and housing continued to sink as inflation sapped strength from volume. Even the surge in consumer activity is clouded by the fact that holiday shopping has been pulled well forward due to concern about availability at any price. Thin inventories suggest some payback over the next two months. Now, concern about both the supply of holiday services -- with potential closings or avoidance of entertainment venues and restaurants -- and demand for goods, if shoppers stay home, threaten to truncate the fourth quarter bounce and an above trend performance in 2022. We were already in the bearish camp, in part because we never thought COVID issues were fully behind us – either as to how they affect consumer behavior or through their impact of supply chains, especially in Asia.
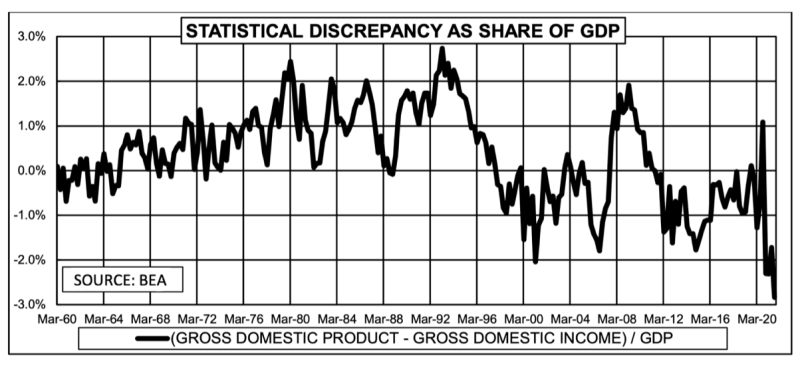
Before the Black Friday COVID news broke, we had run new numbers based on Wednesday’s release of data on October consumption and income, durable goods and new home sales. We lifted our fourth quarter estimate to 5.0%, with real consumer spending estimated at 6.0%. We remain more cautious than the consensus despite the strong October sales gain from early holiday shopping because we suspect much of it reflects a further draw down of inventories – much of which was imported from foreign shores. The US industrial production data last week do not suggest there has been a rebound in output, except for autos. Nor do the October services consumption numbers support stronger GDP growth, as they average just under 5% for the past three months. Consumption is easily the strongest area of GDP, with capital spending and construction likely to again be drags, while inventory growth other than from net imports should again be limited. We have long argued that a macro forecast is simply an average of sectors – so if you want to forecast strong growth you need to identify the sector that is booming, or in a recession the area that is collapsing. As we can find no driver stronger than retail sales – which likely overstate their true impact on current domestic output due to seasonals, inflation, imports, or inventory reduction – and can see clear drags elsewhere, we remain cautious. The COVID scare only reinforces (rather than amplifies) our stance. One technical factor that has us concerned about the quality of a lot of the data is the explosion in the statistical discrepancy – which measures the difference between the BEA’s estimates of the size of the US economy based on production and income. The production estimate (GDP) comes from adding up nominal spending in the various sectors (consumption, capital investment, government spending and exports) then adjusting for imports and changes in inventories to reveal output in the current quarter. Income is a similar compilation adding up estimates of: compensation; transfers; income from interest, dividends and rents; charges for depreciation and indirect taxes (not on income, but rather sales, excise, tariffs, fees, etc.); and an estimate of corporate profits and proprietors’ income. As a matter of accounting, they should add up to the same number – as every dollar of earned from output is paid to some source of production – but practically they don’t due to errors is estimation. Until the 1990s, output rose steadily faster than income, but since the turn of the century the gap has averaged -0.5%, with income slightly larger than output, but with great volatility. Just ahead of COVID, the two estimates were in close sync with the discrepancy just fractionally under zero in the second half of 2019. Today, the gap has spread to a record -2.7% of GDP, as income has recorded much stronger growth than output over the past seven quarters. (Italics and Bold by Kotok)
Which is right? There are obviously proponents for both camps, else the data would already be adjusted. Some will argue that income from especially services is overstated, while others will argue that a strong equities market proves income and profits are strong. We note that recent revisions to compensation added 1.0% over the previous two quarters – with no adjustment to spending, so it raised the savings rate. This is important, as last month’s income report indicated the savings rate had declined to pre-COVID levels. The new revisions imply that that return only occurred in October. In any case, a key argument for stronger than trend growth in 2022 is that consumers will spend out of savings – lowering the saving rate even further. However, if the statistical discrepancy is wrong, because we are overestimating income, then the real savings rate may already be well below pre-COVID levels, and one must question how long it can or will stay there.
In our view, the weakest link in the measurement of GDP and income is the guesstimates of corporate profits and proprietors’’ income. These are naturally reached as residuals, taking all of business revenues then eliminating payments to labor (compensation), capital (depreciation, dividends, interest and rent) and government (indirect taxes) to reveal the return to entrepreneurism. Where most estimates on output and other sources of income are tied to some measurement – retail sales, service consumption, durable goods orders, construction spending, government budgets, employment and earnings – profits and proprietors’’ income are only really known with a three-year lag when income tax data is revealed. Even this data is suspect due to the increased concentration of high-end income. The bottom line is we are wary of the strong profits implied in the National Income & Product Accounts when the statistical discrepancy is this wide. Again, this is important, because there is historically a very strong correlation between capital spending and profits. We are more willing to believe that the current sluggishness in the real value of new orders for non-defense capital goods ex-aircraft is about weak profits and productivity, rather than about apparently very profitable firms being resistant to high prices. In the consumer world, the surge in October activity appears to reflect the fact that consumers fat with cash and a strong desire to celebrate a big holiday season were willing to pay whatever price – driving up both real volume and price. Businesses do not seem to be exhibiting the same devil may care attitude. Most likely because unlike consumers who have a boatload of savings from earlier money drops, businesses – and especially small businesses – did not get enough PPP and other subsidies to put them in the same joyous mood. Thus, we are not big believers that a capital spending surge will lift growth and productivity in 2022 and beyond.
Indeed, we have been conflicted about the optimism on 2022 because it believes one of two tales (or both) either that consumers will spend out of savings, driving higher production, or that firms will pay labor to rebuild inventories, driving higher production. Stronger capital spending boosts either story. Both assume shortages and inflation are largely due to a lack of domestic production, rather than insufficient imports and logistic issues. They have he Fed tightening to rein in demand. We believe high prices are already slowing demand (as in housing) and creating solutions to bottlenecks (as in auto chips), with less need for Fed action.
We think it is far more likely that firms try and return to pre-COVID profit margins – knowing that they will soon be losing subsidies – than to rebuild output or inventories. Indeed, being slow to rebuild inventories means inflation will do more of the margin expansion for them. That strategy implies less hiring and less capital spending. Their risk is that the Federal Reserve tries to curtail aggregate price increases – so each firm needs to increase their prices before the punch bowl is taken away. Those that don’t get margins reestablished likely fall by the wayside as the rich get richer and consolidate control of both volume and prices.
While many are enamored of the decline to 199,000 in initial claims during this holiday week, we believe the modest 60,000 decline in continuing claims (reported with a one-week lag) tells us that next week’s employment report may be disappointing. In the four weeks between the survey weeks for the October employment report, continuing claims fell a hefty 572,000 – and the household survey confirmed that nearly all of the new hires that month came from the long term unemployed. This made sense, as we knew there was a surplus of recent benefit losers and many firms wanting seasonal hires – earlier than normal as they pulled holiday shopping forward. Over the four weeks covering the November employment report, continuing claims fell just -190,000. We posited last month that the well of previous benefit receivers may be running dry, making it harder and more expensive to hire. Moreover, with much of the holiday season already behind us, firms have less need to hire more workers. The question now is will they lay off earlier than normal if there is little inventory for post-Christmas sales? They should to maximize profits!
We believe the best model for divining where the economy is going is to figure out how businesses will best protect or expand profits. Right now, labor is expensive and imports are hard to get. It doesn’t look much better for 2022. So, expecting to raise revenues through strong volume is difficult. Increasing revenues through higher prices is currently relatively easy – especially for the goods side of the economy. And since wages are rising fastest in that sector – limiting firm’s ability to add volume – inflation is the path of least resistance. Meanwhile, higher rents seem certain. Thus, even before the Federal Reserve begins to act, many service providers may find they are being crowded out by both other firms’ higher prices and slowing income growth as hiring moderates. We expect that process will separate the wheat from the chaff, with zombies falling by the wayside leaving more labor and customers for survivors. Whether the re-appearance of COVID leads to a slowdown awaits better information, but the risks are apparent -- and unlikely to go away as quickly as they arose. (Oh yeah, guess maybe that SPR thing isn’t needed anymore. Better to buy while oil is cheap.)
David R. Kotok
Chairman of the Board & Chief Investment Officer
Email | Bio
Links to other websites or electronic media controlled or offered by Third-Parties (non-affiliates of Cumberland Advisors) are provided only as a reference and courtesy to our users. Cumberland Advisors has no control over such websites, does not recommend or endorse any opinions, ideas, products, information, or content of such sites, and makes no warranties as to the accuracy, completeness, reliability or suitability of their content. Cumberland Advisors hereby disclaims liability for any information, materials, products or services posted or offered at any of the Third-Party websites. The Third-Party may have a privacy and/or security policy different from that of Cumberland Advisors. Therefore, please refer to the specific privacy and security policies of the Third-Party when accessing their websites.
Cumberland Advisors Market Commentaries offer insights and analysis on upcoming, important economic issues that potentially impact global financial markets. Our team shares their thinking on global economic developments, market news and other factors that often influence investment opportunities and strategies.
