Our midyear outlook is an overview of Cumberland Advisor’s thoughts on the financial markets. Clearly the overriding theme for the financial markets has been the war in Iran, which began at the end of February, and the accompanying effects from the resulting price of oil. Rising fuel prices have also spilled over higher inflation, but also higher inflation expectations and lower consumer confidence. The bond markets have seen a significant rise in rates with the 10-year US Treasury bond yield rising from 3.95% at the end of February to 4.65% as we are finishing this outlook. We also have a new Federal Reserve Chairman in Kevin Warsh. Though there has been no movement in the fed funds target rate, Chairman Warsh has made it clear that he sees inflation reduction as his number one job at this time.
The equity markets, after some initial pullbacks because of the war, continued to progress on solid earnings from technology companies in particular and have shaken off the inflation concerns that have affected the fixed-income markets more than equity markets. The on-again, off-again nature of hostilities has caused more volatility for bond markets than for equity markets. Artificial intelligence remains the overall driver of higher equity markets though we have seen some breadth come into the overall markets.
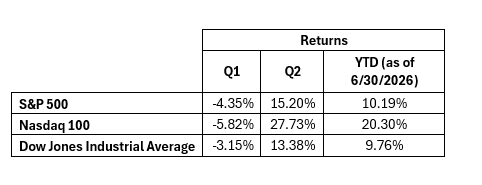
The second quarter of the equity markets saw rising returns:
Economic Outlook – David Berson, Chief US Economist
Review of the US economy over the first half of 2026
The US economy in the first half of 2026 was hit by three negative forces – tariffs, geopolitics, and inflation – each shaping the Federal Reserve’s policy stance and the broader macroeconomic trajectory. Despite this, the economy continued to expand at around trend rates, with the unemployment rate remaining at historically low levels (plus equity markets rising to record levels), driven by massive spending on data centers and record high consumer net worth.
Growth and the Tariff-Driven Price Environment
Real GDP growth rebounded early in the year, rising at a 2.1 percent annualized pace in the first quarter after a weak end to 2025, shaped by a government shutdown. Much of this rebound reflected fiscal impulse from the 2025 Budget Reconciliation Act as well as from data center spending. The Atlanta Fed’s GDPNow estimates a slight slowdown in real GDP growth to 1.7 percent in the second quarter. (We think it will be a bit faster.)
Tariffs played a central role in shaping the economic environment, in terms of raising prices and increasing business uncertainty as tariffs were announced and then changed (or removed by the courts). By mid‑2026, the effective US tariff rate had risen to roughly 7.2 percent according to the USITC/Penn Wharton Budget Model, but other estimates were as high as 15 percent, reflecting a sweeping protectionist regime that pushed up domestic prices for imported consumer goods. The Federal Reserve’s July 2026 Monetary Policy Report noted that tariff increases had directly contributed to higher consumer prices, with pass-through effects visible across durable goods categories.
This tariff-driven inflation was not merely a relative-price story. It interacted with supply-chain disruptions and energy shocks to create a broader inflationary impulse, complicating the Fed’s efforts to maintain price stability.
Geopolitics and the Iran Conflict: Energy Shock and Strategic Uncertainty
Of course, the most consequential geopolitical development was the US–Iran conflict, which escalated sharply in early 2026 and triggered a major energy shock. The closure of the Strait of Hormuz for more than 15 weeks sent oil and gasoline prices soaring.
Driven by soaring energy prices, the Consumer Price Index (CPI) rose by 4.2 percent from a year earlier in May (although lower energy prices during the apparently brief cease-fire between the US and Iran allowed that to slip to 3.5 percent in June). The Fed reported that PCE energy prices rose by 24 percent year-over-year through May, driven by the conflict’s disruption of shipping routes and damage to regional energy infrastructure. Oil prices became highly volatile, fluctuating with news of negotiations between the US and Iran.
By mid-June, a 14‑point memorandum of understanding (MOU) between the two countries provided cautious optimism:
- Immediate cessation of military operations
- Temporary sanction‑free Iranian oil exports
- A 60-day commitment to secure commercial passage through the Strait of Hormuz
This agreement reduced downside risks but did not immediately normalize global commodity flows, leaving energy markets tight and inflation elevated. The geopolitical shock also spilled into other commodities – especially fertilizer and helium – further contributing to supply-side inflation pressures. And the recent resumption of hostilities has pushed energy prices higher again and disrupted supplies in the region.
Inflation: Reacceleration and Structural Pressures
Inflation reaccelerated meaningfully in the first half of 2026, as noted above.
Key drivers of the inflation pulse included.
- Tariff pass-through, raising goods prices
- Energy shock from the Iran conflict
- Labor‑supply constraints, especially a sharp drop in immigration flows in response to sharply increased immigration enforcement
Monthly changes to nonfarm payrolls ranged from a drop of 156,000 in February to a gain of 214,000 in March but averaged a monthly increase of 92,000 over the first half of the year. While this increase is lower than historical averages, it is still probably a bit above trend given demographics and the modest growth rate of the overall economy. The unemployment rate edged down to 4.2 percent, but the labor force contracted by 720,000, reflecting the ongoing retirements among the baby-boom cohort and a collapse in participation tied to immigration restrictions. Labor shortages have pushed up wage pressures even as job creation slowed.
Some trimmed-mean inflation measures moderated, suggesting that idiosyncratic price spikes (e.g., oil) were not universal. But the broader trend pointed toward inflation’s remaining above the Fed’s 2.0 percent long-term goal. And the recent jump in energy prices and still more tariffs suggest that upward inflation pressures remain (and could intensify).
Federal Reserve Policy: Holding the Line Amid Rising Prices
Under its new chair, Kevin Warsh, the Federal Reserve maintained the federal funds rate at 3.50–3.75 percent at the June FOMC meeting, signaling a cautious stance amid rising inflation and still-solid economic activity. Markets priced a high probability of at least one rate hike by September.
The central bank faces a difficult balancing act: Tightening too aggressively risks undermining the ongoing expansion (made more tenuous by the jump in energy prices and tariffs), while insufficient tightening (or easing) risks entrenching inflation expectations. But statements from Warsh and other FOMC members have clearly indicated that, at least for now, inflation is squarely in their crosshairs.
Financial Markets and Capital Flows
Despite protectionist policies and geopolitical uncertainty, US financial markets remained buoyant. Foreign private capital inflows were exceptionally strong, with net purchases of long-term US securities exceeding $150 billion in March and totaling $1.55 trillion in 2025.
The S&P 500 Index climbed to a record high in early June, up by roughly 11 percent from the end of 2025. While the index slipped some over June, it ended the first half up by about 21 percent from a year earlier, reflecting investor confidence in US assets even as inflation pressures mounted.
Interest rates moved generally – if modestly – higher over the first half of the year, despite no change in Fed policy, with the yield on the 10-year Treasury note climbing from just under 4.2 percent at the start of the year to a bit over 4.4 percent at midyear. Higher inflation and increased federal budget deficits were no doubt contributors.
Conclusion: A Resilient but Strained Economy
The first half of 2026 revealed an economy that was resilient but increasingly strained. Growth held up, supported by fiscal policy, spending by consumers in the top-half of the income distribution, and data center construction. But inflation reaccelerated, driven by tariffs, energy shocks, and labor-supply constraints. Geopolitical tensions with Iran amplified commodity-price volatility, while the Federal Reserve maintained a cautious stance, holding rates steady amid rising price pressures.
We expect the economy to continue growing over the second half of the year, supported by continued consumer and data center spending, with inflation slowly receding. But there are significant risks to that view:
We expect the economy to continue growing over the second half of the year, supported by continued consumer and data center spending, with inflation slowly receding. But there are significant risks to that view:
- Another jump in energy prices and supply constraints from further hostilities in the Middle East
- Additional tariffs that stick longer
- More labor shortages from immigration enforcement and retiring baby-boomers.
Equity Markets – Matt McAleer, President & Managing Director of Private Wealth
As we look ahead to the second half of 2026, the backdrop for equities remains generally constructive. Inflation has continued to improve; economic growth has held up better than expected; and corporate earnings estimates remain supportive. While valuations are no longer inexpensive and investor expectations have moved higher, we believe the market can continue to benefit from steady earnings growth, ongoing investment in artificial intelligence, and a Federal Reserve that appears likely to remain patient unless inflation or labor-market conditions change meaningfully. Importantly, market leadership has started to broaden beyond the largest growth stocks, with small- and mid-cap companies, value stocks, and additional sectors beginning to participate. We believe this broader participation is a healthy development and supports our current balanced approach across company sizes and investment styles.
Within US equities, we continue to favor select areas that we believe are supported by durable economic trends. Portfolios remain overweight Industrials, including aerospace-related exposure, while maintaining meaningful allocations to Financials and Technology. Our strategy with regard to Industrials is supported by infrastructure spending, reshoring activity, defense demand, and ongoing capital investment. Technology also remains an important part of the market, particularly companies benefiting from AI-related demand; however, because expectations in this area are elevated, we believe it is prudent to balance technology exposure with sectors that may benefit from a more durable and broad-based economic expansion. Overall, we remain constructive on US equities but continue to emphasize diversification and discipline.
International equities also remain an important part of our overall portfolio construction. After a recent period of strong performance, we continue to view non-US markets as a useful source of diversification. Our current allocation is tilted 60% toward developed markets and 40% toward emerging markets, and we will continue to monitor the US dollar closely. A stronger dollar can be a headwind for international returns, while a weaker dollar is generally supportive. We are also focused on gaining exposure to markets with meaningful technology representation, including Taiwan, the Netherlands, and South Korea. While global markets will continue to be influenced by earnings trends, policy decisions, and currency movements, we remain constructive but disciplined in maintaining diversified exposure across US, developed international, and emerging markets.
Total Return Gov/Credit – Dan Himelberger, Portfolio Manager & Trader
Treasury Market
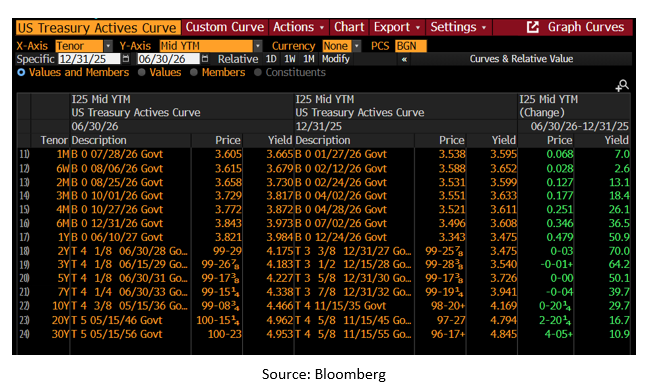
The US Treasury yield curve flattened during the first half of 2026 as short-term yields moved higher amid renewed inflation concerns and expectations that the Federal Reserve would maintain a restrictive policy stance for longer. Rising energy prices following the Iran War contributed to inflation uncertainty, prompting markets to reprice Fed expectations and push front-end yields sharply higher, while longer-term yields rose more modestly because of expectations for slower economic growth ahead. Looking forward, Treasury market performance will likely remain driven by the balance between inflation, economic growth, and the path of Federal Reserve policy. The chart below illustrates the shift in the Treasury yield curve during the first half of 2026.
Spread Movements
Investment-grade corporate and taxable municipal bond spreads finished the first half of 2026 at or near cycle lows, reflecting continued investor demand for high-quality spread sectors. Investment-grade corporates experienced periods of increased volatility, with spreads on the Bloomberg US Aggregate Corporate Index widening to +93 bps in March before rallying to close the period at +74 bps. While geopolitical uncertainty surrounding the Iran conflict contributed to spread volatility in the corporate market, taxable municipals proved to be a more resilient alternative. The Bloomberg Taxable Municipal US Aggregate Index tightened 5 bps during the period to +68 bps, highlighting the sector's relative stability and strong technical support despite broader market uncertainty.
As highlighted in prior reports, we believe much of the return potential from spread tightening in investment-grade corporates and taxable municipals has already been realized. Accordingly, we have maintained an elevated allocation to US Treasuries, a position that has provided both relative value and liquidity amid evolving market conditions. While credit fundamentals remain generally supportive, current spread levels remain historically tight and offer limited compensation for incremental credit risk. As a result, we have not yet begun increasing exposure to higher-spread sectors. That said, we remain disciplined in evaluating opportunities across the fixed-income landscape and stand prepared to adjust portfolio positioning should market volatility or spread widening create more attractive risk-adjusted return opportunities.
Outlook
As we move through the second half of 2026, we will continue to monitor inflation, labor market conditions, and policy developments that could influence economic growth and the path of Federal Reserve policy. While the economy has remained resilient, moderating growth and ongoing inflation uncertainty support a cautious outlook for interest rates and credit markets.
In this environment, maintaining elevated portfolio liquidity remains a key priority, providing flexibility to respond as market conditions evolve. While we remain conservative on credit exposure given historically tight spread levels, we will continue evaluating opportunities across the fixed-income market and stand prepared to selectively add risk when more attractive valuations emerge.
Tax-Free Municipal Bonds – John Mousseau, Executive Vice President & Chief Investment Officer
2026 Mid-Year Forecast
The muni market clearly has done better this year than the Treasury market has. The reason for this is mostly couched in the large number of inflows into municipal bond funds, ETFs, and private accounts. This trend has been ongoing for most of the year, and total flows over the first half of 2026 amount to approximately $58.1 billion. This pace is well above last year’s and has allowed the market to absorb new issuance, which is on track to be 4–5% ahead of last year (near an estimated $600 billion in total). The muni market has also had a reprieve from the battering it took last year from the taxation talk of last March, the tariff scares of last spring, and the irregular issuance patterns (dictated in part by the first two issues) that resulted in an incredible supply bulge in late July a year ago. High-grade issuance has been met with buoyant demand, with many issues being oversubscribed many times. As 2026 began, the longer end of the muni market was much more attractive given the underperformance relative to 10 years and under last year. This steep yield curve has rewarded investors willing to accept longer duration from an income standpoint.
This demand and resulting inflows have continued despite the volatility in the bond markets during the war. Some of this influx reflects cash rotation out of money market funds as the Fed lowered short-term rates at the end of last year. There is also renewed interest in fixed income in general and municipal bonds in particular as equity markets reached new highs and rebalancing occurred in balanced accounts.
This year, many municipalities have gotten a boost from the building of data centers in metropolitan areas. As my colleague Patricia Healy describes here, municipal credit quality remains strong, but it’s important to remember that state and local governments are not receiving the federal funds that were plentiful during Covid. We believe going forward that the municipalities will be somewhat more cautious in issuance given the uncertainties surrounding inflation and Federal Reserve actions going forward.
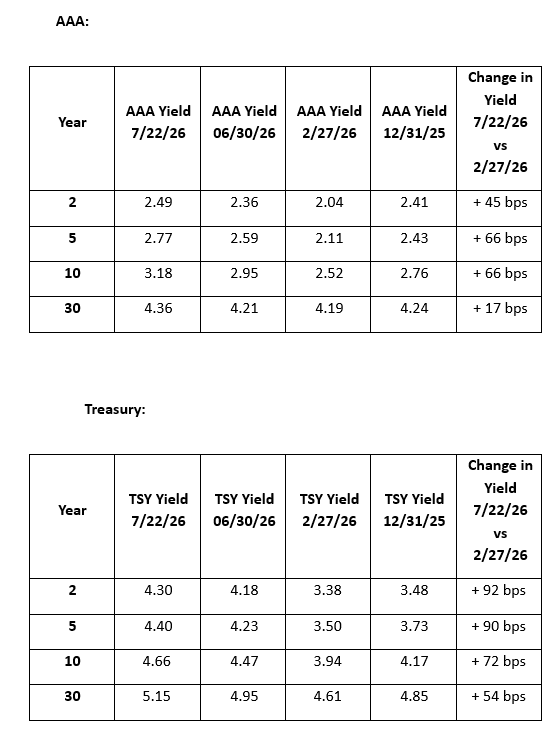
As we roll into the second half of 2026, we are facing the fact the Treasury market is out in front, doing the Federal Reserve’s work for them. Since the truce in the Iran War went awry, brent crude has rocketed back above $100 barrel after declining to $70 barrel after the truce was announced. It’s important to remember that RESERVES are much lower than they were last year. There is a much smaller buffer to supply shocks than there was even earlier this year. Thus price shocks translate to higher interest rates more quickly. And we have seen that recently.
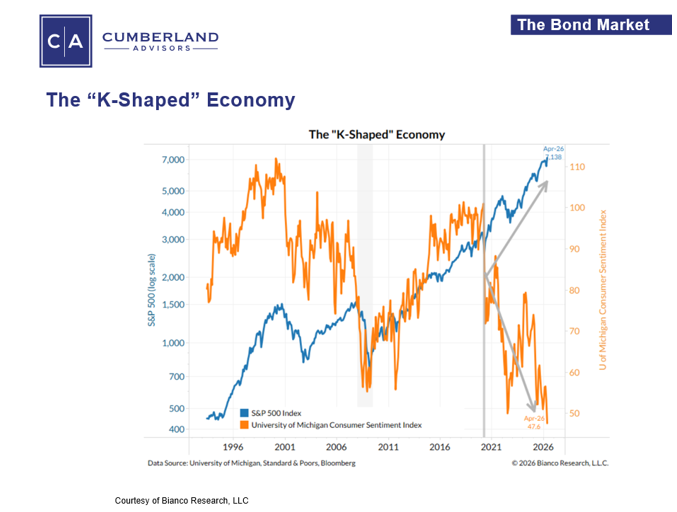
The question for the bond market will be how long the conflict lasts. At the beginning of the conflict, markets were discounting a fairly quick end to the hostilities. The reality has been anything but that. The graph above shows the issue of the K-shaped economy. The divergence it reflects is exacerbated with the twin punches of higher oil prices from the supply side and higher interest rates. Consumers (particularly at the lower end) start to pull back. From the Federal Reserve’s standpoint, consumer behavior reflects both core inflation and the degree to which higher oil prices become embedded in the psyches of consumers. The greater the impacts of these factors, the more aggressive the Fed will be to quash that inflation and negative feedback loops into investors’ reactions.
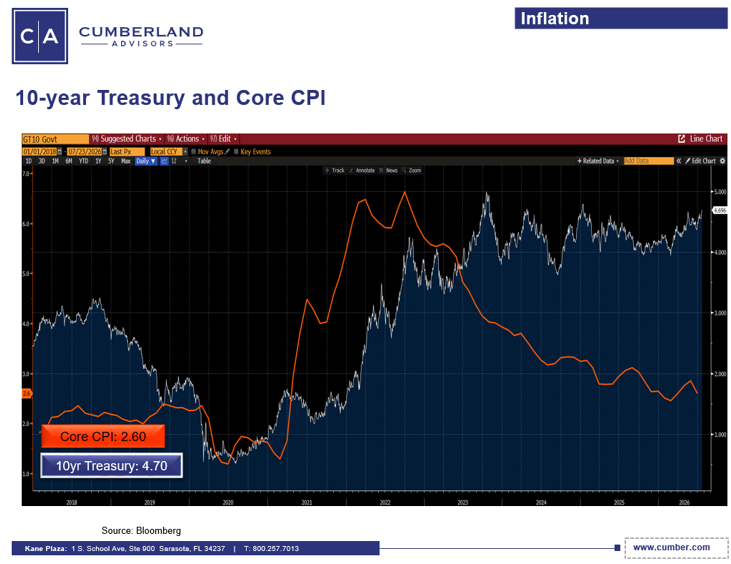
So far, the increase in Treasury rates has moved faster than inflation, and we can see that in the difference between the 10-year Treasury bond yield and Core CPI. From this perspective, bonds overall are attractive. And the question to be answered is how much leakage into core inflation from oil occurs in the second part of this year.
Municipal Credit Outlook – Patricia Healy, SVP, Director of Fixed-Income Research
Second Half 2026 Muni Credit Quality Outlook
Rates are not going down, and it doesn't look as though the Fed will be cutting rates as many anticipated at the beginning of the year. Instead, with inflation sticky from the Iran War and oil prices, AI spending, and economic growth, the Fed may choose to raise the fed funds rate. On the other hand, the recent lower-than-expected inflation readings from the CPI and PPI may forestall FOMC rate increases.
Higher interest rates don't seem to be slowing down muni issuance. Supply is projected to be toward the upper end of the range we surveyed at the beginning of the year, between $520 and $600 billion. The need to invest in infrastructure continues as that investment has lagged and there is now more need to incorporate resiliency against extreme weather events as well as to mitigate cyber risk. Many municipalities are growing as well and need to build infrastructure and expand services. Consequently, we expect muni issuance to stay robust.
Continued strong supply, generally higher rates, and greater interest in high quality investments rather than private credit and stocks all bode well for muni bond demand. Munis can offer attractive taxable equivalent yields, especially in states with high income taxes.
The municipal credit outlook remains stable, but the broad-based improvement that characterized the post-pandemic period is waning. However, muni credit quality remains good, with many bonds rated AAA and AA.
It looks like the years of upgrades surpassing downgrades have ended, at least through the first six months of 2026. S&P’s interactive rating dashboard shows 308 downgrades compared with 193 upgrades. The trend did not extend across the board. Upgrades outpaced downgrades in the states, public power, not-for-profit, healthcare, housing, and transportation sectors. Downgrades outpaced upgrades in local governments, education, charter schools, and utilities sectors.
As pandemic-era federal assistance winds down, many issuers are beginning to draw upon reserves accumulated during the last several years. This trend was largely anticipated. Fortunately, many municipalities entered this transition period with historically strong reserves as a result of federal stimulus programs, strong economic growth, rapid property value appreciation, and disciplined budgeting practices. Draws on reserves do not automatically result in rating changes, as reserves are there to prepare for a rainy day and to provide flexibility. If reserves decline to what are considered low levels and budgets are not balanced, then ratings could change.
Investment-grade munis are considered a safe fixed-income investment. The reserves help munis manage through challenges such as changes in federal funding and demographics, cyber threats, and climate disasters. Munis have generally higher credit quality than corporate bonds do, with an average rating of AA compared with BBB for corporate bonds. Munis ratings span the spectrum, with larger, more diverse municipalities often better equipped to manage through challenges while smaller and rural municipalities have less flexibility to address challenges. Careful credit selection remains important.
Thoughts from David Kotok, Co-Founder & Strategic Advisor
Size Matters — Or Does It?
In our modern financial markets, absolute dollar size has become its own gravitational force. Trillions of dollars can now move with a single product launch. Massive amounts can change on a single corporate earnings call. Or with a single rocket landing or a rocket-launch explosion.
SpaceX was once a scrappy disruptor. It now commands a market valuation that rivals all the legacy aerospace giants combined. Nvidia, propelled by the AI boom, has grown so large that its daily price swings can shift entire indices. And now we have witnessed the first-ever $1 trillion ETF, a milestone once unimaginable. I remember when SPY was launched in 1993. DIA was next in 1997. Sector Spiders followed two years later. No one envisioned that a trillion-dollar number for a single ETF would be reached in a single generation.
So, what are the implications that come size? As with anything else, there is a debate.
On one hand, scale can be stabilizing. Think of it like a massive chain anchor holding a large ship in a storm. Large ETFs tend to be diversified. They are broadly held. They are liquid and can dampen volatility rather than amplify it.
For a single stock, Nvidia’s size means that its investor base is deep and global. As long as the company performs, size reduces the likelihood of a panic-driven collapse. SpaceX’s massive private valuation gives it access to capital on terms that allows the company time for its needed long-term planning. It currently is not about quarter-to-quarter earnings comparisons. So, from this side of the coin, trillion-dollar financial instruments are like supertankers: slow to turn, hard to tip over, and capable of smoothly navigating the chop around them.
But the counterargument is equally compelling. When a single ETF crosses the trillion-dollar threshold, its flows can distort the very markets it tracks. Nvidia’s enormous market cap means that a bad earnings day can erase more value than the GDP of a small nation. When that happens, it drags indices with it.
And SpaceX, despite its brilliant, imaginative prospects, represents private market risk. When a large company stumbles, the shockwaves can be huge. They hit pension funds, sovereign wealth funds, and institutional portfolios that have quietly tied themselves to the company’s ascent. In this framing, size doesn’t stabilize—it magnifies shocks.
Last, there’s the psychological dimension. Some investors behave differently when numbers reach the trillions. Is a trillion-dollar ETF “too big to fail?” Does the classic call for a government bailout surface? That is the ongoing debate about “moral hazard.” Large size can create complacency.
Nvidia’s meteoric rise can tempt investors to treat it as a permanent fixture rather than a company subject to competitive and technological cycles. SpaceX’s scale can make its ambitions seem inevitable, even though aerospace remains one of the riskiest industries on earth. When financial objects become enormous, narratives become enormous too—and narratives can be volatile. Just consider the language about a resort vacation on the moon. Maybe in low gravity I can throw my fly rod 500 feet. 😊
Joking aside, it’s impossible to ignore the benefits of scale in innovation and efficiency. SpaceX’s size allows it to lower launch costs for the entire world. Nvidia’s scale accelerates AI development across industries. A trillion‑dollar ETF offers low fees, high liquidity, and broad access to markets that once required specialized knowledge. So in this sense size democratizes opportunity. It spreads risk. It builds infrastructure that smaller investors cannot otherwise obtain.
So, does size matter? Absolutely. But whether it stabilizes or destabilizes depends on the lens. Large financial entities can be anchors or amplifiers, depending on how they’re built and how investors behave around them. The real challenge is not their scale, but our assumptions about what that scale guarantees.
Trillions of dollars can calm the seas—or they can make the waves taller. The market decides which, and it rarely decides quietly.
Disclosure: David Kotok owns SPY in his portfolio. He does not hold SpaceX or Nvidia.
John R. Mousseau, CFA
Chief Investment Officer
Feedback | Bio
Sign up for our Market Commentaries
Cumberland Advisors Market Commentaries offer insights and analysis on upcoming, important economic issues that potentially impact global financial markets. Our team shares their thinking on global economic developments, market news and other factors that often influence investment opportunities and strategies.
Links to other websites or electronic media controlled or offered by Third-Parties (non-affiliates of Cumberland Advisors) are provided only as a reference and courtesy to our users. Cumberland Advisors has no control over such websites, does not recommend or endorse any opinions, ideas, products, information, or content of such sites, and makes no warranties as to the accuracy, completeness, reliability or suitability of their content. Cumberland Advisors hereby disclaims liability for any information, materials, products or services posted or offered at any of the Third-Party websites. The Third-Party may have a privacy and/or security policy different from that of Cumberland Advisors. Therefore, please refer to the specific privacy and security policies of the Third-Party when accessing their websites.