This is an overview of Cumberland Advisors’ thoughts on financial markets as we head into 2026. As we come off the first year of President Trump’s second term, the markets have encountered several themes and events that we have not dealt with in the recent past. They include economic nationalism and tariffs, hardline immigration and border enforcement, the administration quarreling with the Federal Reserve over the level of short-term interest rates, cultural wars over environmental and diversity programs, and maximizing the use of presidential power in the field of foreign relations. This past year saw a rise in the S&P 500 of 16.39%and in the Nasdaq of 20.36%. The ten-year US Treasury yield declined from 4.57% at the start of the year to 4.17% at year end. Municipal bond yields had a mixed year, with shorter-term yields dropping and longer-term yields rising. This is our outlook, with several crosswinds facing us. Feel free to reach out to any of us. We always welcome questions or comments. Happy Belated New Year.
Economic Outlook – David Berson, Chief US Economist
The US Economy in 2025: A Year Marked by Stark Dichotomies
Strong GDP growth but a slowing job market. Surging spending on artificial intelligence (AI) but slower spending in much of the rest of the economy. Tariff-induced price hikes but sharply lower oil prices (and modestly reduced overall inflation). Expansionary fiscal policy widening the federal debt/GDP ratio but Fed easing. These are some of the dichotomies that marked the US economy in 2025.
Economic Activity
Big, mostly international trade-induced, swings in quarterly growth characterized the top-line of the economy in 2025. Annualized first-quarter real GDP growth fell by 0.7 percent as a surge in imports to beat the imposition of tariffs was counted as a negative by the vagaries of national income accounting. This dip was mostly offset in the second quarter and was overwhelmed by strong growth over the remainder of the year. Using the Atlanta Fed’s GDPNow estimate for the fourth quarter (as of January 9), growth for the year rebounded to 3.1 percent – well above consensus estimates of trend growth at around 1.8 percent. Spending was especially strong on AI and in the federal government sector, while other business investment, residential, and consumer spending slowed, facing the headwinds of higher borrowing rates in the first half of the year and tariffs in the second half.
Despite the solid growth of real GDP in 2025, nonfarm payroll gains slowed to a trickle over the second half of the year. For all of 2025, payrolls grew by 584,000 persons; but the monthly average through April was 122,750, before it slumped to only 11,625 for the remainder of the year. While payroll growth has been slowing each year since the post-Covid bounce, the second-half performance was in a different category altogether – more indicative of a pre-recession job market. Interestingly, this sudden drop off in payrolls occurred after President Trump proclaimed “Liberation Day” (the day when he announced the highest tariffs since the Great Depression’s Smoot-Hawley tariffs). Correlation doesn’t imply causation, of course, but in this case tariff uncertainty has likely caused businesses to put a hold on new hires. Firms also apparently held fast to their current workers, as shown by relatively stable and low weekly initial unemployment claims. The “no hire, no fire” job market, indeed.
How can we reconcile strongly above-trend economic growth over the final three quarters of the year with virtually no new hiring? Productivity exploded over this period, boosting economic growth. (And since productivity is a supply-side factor, it should be mostly noninflationary growth). Has the sharp rise in AI-related spending suddenly caused this pickup in productivity? While AI may have had a small impact on the rise in productivity so far, it is too soon and the investments are not yet big enough to have had a significant impact. The good news is that the surge in AI spending should have an increasing impact over time on boosting productivity. The bad news, however, is that the recent rise in productivity is probably coming mostly from short-term cyclical factors and so will likely diminish.
Trend economic growth can be thought of as the sum of productivity growth and growth of the labor force. As noted, the former has increased sharply (although perhaps only temporarily) while the latter is likely to slow in response to immigration policy changes instituted this year. These changes will not only slow immigration into the US, but they will also reduce the labor force directly as illegal immigrants are removed from the country. This dynamic may help to explain some of the slowdown in job growth over 2025, and it certainly suggests slower labor force growth (and thus trend economic growth) in coming years.
While the legality of his tariff policy is still the subject of litigation, President Trump unilaterally raised tariffs on a broad range of goods and services with almost all nations. The average US tariff rate rose to approximately 16.8 percent, the highest since 1935. Although that average is certainly high, tariff rates whipsawed over the April-December period (although they were less volatile starting in the fall). This policy volatility created significant uncertainty for firms and likely meant less activity and less of a passthrough of tariffs to the prices of goods and services. Still, it is well understood that tariffs are a negative supply shock that slows economic growth and pushes prices higher. But didn’t real GDP growth accelerate this year? Yes, but it is still possible (likely) that tariffs slowed underlying economic growth. The vast amount of spending on AI this year could have more than offset the negative impact of tariffs on growth. But more to the point, a better measure of underlying spending in the economy is real final sales to private domestic purchasers (RFSPDP) – removing exports, imports, and government spending and leaving the main GDP categories of consumer and business investment spending. Growth of RFSPDP edged lower over the course of 2025 (data through the third quarter), as expected. The increase in tariffs did raise federal government revenues by around $200 billion in 2025, but at a high cost to the economy (slower growth and higher inflation).
Inflation
Trend inflation (the 12-month change in the CPI) continued to moderate from its 2021–2022 highs into April/May, before moving higher and ending 2025 only a bit below where it started. Of course, that April/May period is when tariffs were announced and initially implemented. From a peak of about 9.0 percent in July 2022, trend CPI fell to a low of 2.3 percent in April 2025 – but it began and ended the year at about 3.0 percent. As noted above, tariffs are a negative supply shock that should raise prices. Given the magnitude of the tariffs, however, many analysts were surprised that prices didn’t rise by more. It is likely that importers didn’t let tariffs fully flow through into prices, either because they were trying to keep up market share or because the volatility of announced tariffs created uncertainty about where they would finally end up. In either case, it is possible that a more complete flow of tariffs into prices will occur in 2026. Movements in trend core inflation (removing the volatile food and energy components) were similar to the overall CPI.
Unfortunately, the federal government shutdown disrupted price surveys for October, and the data for November/December may be a bit less accurate than usual because of the difficulty in appropriately measuring the housing components of the CPI with no survey for October. The reported rates should be viewed as rough approximations.
Federal Reserve Policy and Interest Rates
The Federal Reserve has three congressional mandates: price stability (which the Fed defines as 2.0 percent inflation), maximum employment, and low long-term interest rates. The Fed actively tries to attain the first two mandates, with the third being a byproduct of achieving success with the first two. Over the course of 2025, the Fed dropped the target federal funds rate by 25 basis points (bps) three times for a total cut of 75 bps, bringing the rate down to a range of 3.50–3.75 percent. This is the lowest fed funds rate target range since November 2022. The Fed also ended sales of Treasury and mortgage-backed securities from its portfolio (quantitative tightening, or QT).
Were these policy actions appropriate in meeting their mandates? The Fed faced a difficult environment in 2025, with a slowing job market and modestly rising inflation. As noted previously, tariffs are a negative supply shock – acting to slow growth and increase prices. The Fed’s policy tools are insufficient to fight these sorts of shocks. Expansionary monetary policy can help to offset a slowing job market, but at the cost of potentially increasing inflation. Or contractionary monetary policy can help to offset higher inflation, but at the cost of potentially increasing the unemployment rate. On the other hand, AI has the potential to be a significant positive supply shock, boosting productivity growth and making the Fed’s job much easier with inflation and unemployment both moving lower. But tariffs are here now and AI is still only potential.
While the Fed can control short-term interest rates, long-term rates can only be influenced by the Fed. In addition to the movement in short-term interest rates (determined mostly by the Fed), long-term rates are influenced by expected inflation and the supply and demand for those securities. For example, the financing of record federal budget deficits increases the supply of Treasury securities – potentially reducing their price and moving their yields higher. Using the 10-year Treasury note as the benchmark for long-term interest rates, long-term rates climbed to their highs for the year early in 2025, at nearly 4.80 percent. By year end, despite record budget deficits and inflation’s edging higher, the 10-year yield had dropped to around 4.20 percent (although the low for the year occurred in late October at just under 4.00 percent). Easing by the Fed probably helped long-term rates fall (especially with the Fed signaling additional modest cuts this year and next). But the biggest part of the decline in long-term rates in 2025 likely came from the insatiable demand for what world financial markets consider to be the safest long-term asset.
Fiscal Policy
Fiscal policy in 2025 was dominated by the One Big Beautiful Bill Act (OBBBA), a sweeping tax and spending package signed into law in July. While there were many parts to the OBBBA, among the key provisions were full expensing for equipment and R&D expenditures as well as temporary full expensing for new factories. These positive supply-side provisions could, in future years, increase productivity growth. Additionally, the increases in spending and tax cuts in OBBBA should help to boost economic growth in 2026. But the cost of OBBBA is significant. The Congressional Budget Office (CBO), for example, estimates that over the next 10 years OBBBA could increase the federal budget deficit by about $2.8 trillion (including estimates of how the bill would affect the economy).
Conclusion
The US economy in 2025 was defined by strong headline growth, a slowing job market, faster productivity gains, increasing inflation (over the second half of the year), and major structural policy shifts. Sharp tariff increases created a negative supply shock, but significant spending on AI helped to offset the negative demand impacts of tariffs and may in future years create a positive supply shock. Monetary policy moved to a less restrictive stance while fiscal policy was wildly expansionary.
Equity Markets – Matt McAleer, President & Managing Director of Private Wealth
The encouraging inflation news coupled with solid earnings estimates should provide continued stability for equities into 1H2026. After extreme performance dispersion between cap sizes and sector performance over the past five years, the rally has broadened to include small-caps, mid-caps and multiple sectors. In fact, over the past six months, the Russell 2000 has significantly outperformed the S&P 500. Likewise, value has had a mild bounce vs. growth on the back of strong Financials. We currently employ a blend of growth and value ETFs along with individual equities and are comfortable with that allocation. While diversification has been a drag on performance for a decade, cycles ebb and flow, and markets tend to reward strategies that remain flexible over longer time horizons. Currently, we are interested in remaining balanced between size and style.
From a domestic sector and industry standpoint, the portfolios remain overweight Industrials (XLI, AIRR, XAR), with market weighting in Financials and Technology. It is always a risk to forecast continued strong sector growth, but the relative strength exhibited by these indices and sectors keeps us long.
As continually noted in our Friday Week in Review videos, international equity markets were outstanding over the recent 12 months. We are allocated 60%/40% developed vs. emerging and will continue to watch the $USD for clues on allocations. We are trying to overcome the persistent international technology index underweight by leveraging capital to ETFs with large tech representation. The primary exposure to this strategy is through Taiwan (EWT), Netherlands (EWN) and So. Korea (FRDM). We are encouraged by the market action of Argentina (ARGT) and hope the broader Latin American market will view the positive market reaction to political reform favorably.
Total Return Gov/Credit – Dan Himelberger, Portfolio Manager & Trader
Treasury Movements
The US Treasury yield curve continued to steepen during the second half of 2025, driven primarily by a decline in short-term interest rates following three 25-basis-point rate cuts by the Federal Reserve. These policy actions pushed front-end yields sharply lower, while longer-dated yields drifted modestly higher over the period. The divergence reflected investors’ demand for a higher term premium at the long end of the curve, as uncertainty persisted around the trajectory of inflation, the durability of economic growth, and the expanding US fiscal deficit. The chart below illustrates the full shift in the Treasury yield curve over the second half of 2025.
Source: Bloomberg
Spread Movements
Investment-grade corporate and taxable municipal bond spreads remained at or near cycle lows during the second half of 2025. Over the period, taxable municipals modestly outperformed investment-grade corporates, as spreads tightened more meaningfully in the municipal market. Specifically, the spread on the Bloomberg US Corporate Bond Index narrowed by 5 basis points to finish the year at +78 basis points, while the spread on the Bloomberg Taxable Municipal US Aggregate Index compressed by 12 basis points, ending the year at +73 basis points.
As highlighted in prior reports, we believe much of the return potential from spread tightening in these asset classes has already been realized. In response, we gradually reduced our overweight exposure to spread products over the past year while increasing allocations to US Treasuries, a decision that has proven beneficial amid evolving market conditions. We continue to view current spread levels as historically tight and, at this time, have not yet begun reallocating portfolios back toward higher spread exposure. That said, we remain vigilant in monitoring relative value across these asset classes and stand ready to adjust positioning should more attractive opportunities emerge.
Outlook
As we enter the first half of 2026, we will continue to closely monitor key economic indicators, with particular focus on inflation trends and policy developments from the Trump administration. Our current outlook places the 10-year US Treasury at fair value in the 4.15%–4.25% range, with yields likely to trade within a broader 4.00%–4.50% band. This wide range underscores the elevated uncertainty surrounding fiscal and regulatory policy, as well as the heightened market volatility experienced in recent quarters.
In this environment, our priority will be to maintain elevated levels of portfolio liquidity, providing the flexibility to respond efficiently as conditions evolve. While we intend to remain conservative in our approach to credit exposure, we will stay actively engaged in identifying and selectively capitalizing on compelling investment opportunities as they emerge.
Tax-Free Municipal Bonds – John Mousseau, Executive Vice President & Chief Investment Officer
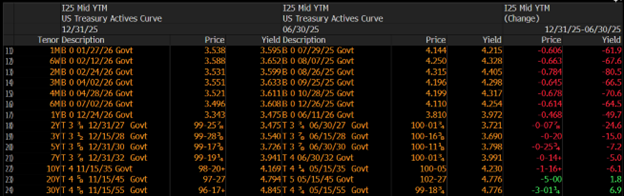
The charts below show the yield changes in the fourth quarter of 2025.
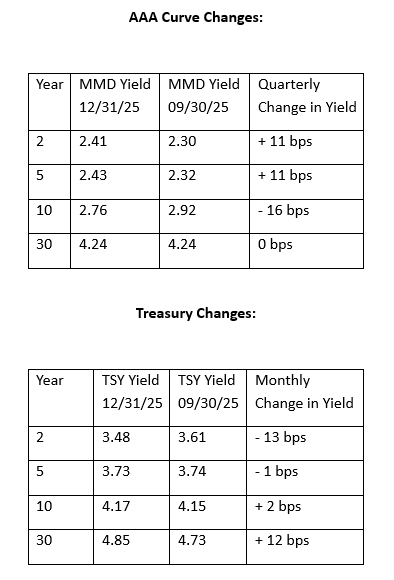
Source: Bloomberg
As we can see, the muni market enjoyed a better relative fourth quarter than Treasuries. This was a result of the muni market rallying after the falloff last July among an onslaught of issuance. Indeed, the new-issue supply for 2025 ended up at $579 billion, a record, breaking 2024’s $507 billion of issuance.
The muni market was battered by three periods of illiquidity during 2025. The first was in March, with talk in Congress about taxing municipal bonds. The market goes through this every few years, almost always in conjunction with a new administration. In the end, Congress did nothing, but this didn’t stop the market from freezing up while it was discussed. The volatility of April, with tariff talks and initial talk of Jay Powell being replaced at the Fed, shocked the Treasury market to temporarily higher yields and also froze the muni market briefly. And finally, the onslaught in late July by issuers (many of whom had postponed issuance from the spring) overwhelmed the markets. The longer end of the muni market got hurt the most during this bout of illiquidity. This can be seen in the difference of the AAA muni yield curve at the beginning and the end of the year.
The shorter end inside of 15 years dropped in yield as the Federal Reserve resumed cutting short-term interest rates in September. The market front ran this move with drops in yields in the front end of the curve. But the longer end, which is dominated by retail accounts, faded early in the year, with yields higher as nervousness set in on concerns about potential inflation, the Federal Reserve, and taxation issues. You can see this in the graph below.
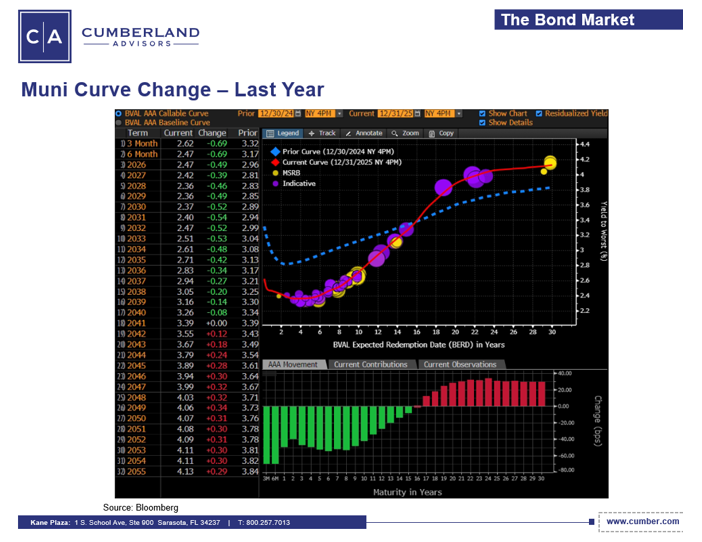
As we head into 2026, there are plenty of cross currents buffeting bond markets: Japan, which is facing rising bond yields due to fiscal issues; political uncertainty surrounding who the new chair of the Federal Reserve will be and what the future is for Fed independence; a Supreme court decision on the President’s authority regarding tariffs, etc. However, we believe that the Federal Reserve will at some point start to lower short-term rates again. They have clearly turned towards more importance directed at the labor front and maybe a little less at the inflation front. There are many anecdotal signs that the economy is slowing down – whether it is home sales declining, credit card delinquency rising, a rise in unemployment, or drops in various manufacturing indices. We think the intermediate part of the yield curve from 14–19 years will benefit when rates are cut. And the longer end remains very cheap on a taxable equivalent basis. The drop in year-over-year CPI in recent months means that REAL yields are higher – and thus somewhat restrictive.
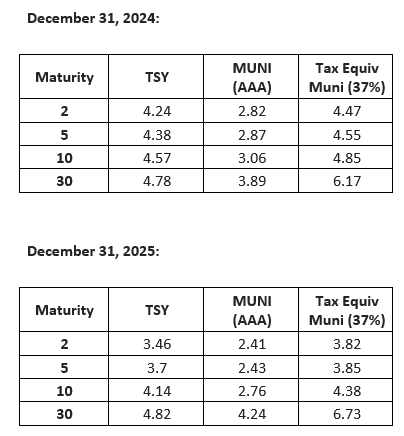
This chart compares the AAA muni yield curve at the beginning the year and the end of the year and shows the taxable equivalents of both curves. In looking at this you can see value proposition of the longer high-grade muni credit. As we move beyond some of this early-year buffering, we think muni yields will continue a slow decline.
Municipal Credit Outlook – Patricia Healy, SVP, Director of Fixed Income Research
Muni Credit Quality Outlook 2026
The surprising strength of the economy and the stock market bodes well for muni revenue growth from taxes and fees. The changing federal landscape regarding aid to states for healthcare and disaster relief, the ending of pandemic funding, the burden of tariffs, and in some cases the pullback of previously appropriated congressional funding have led to some consternation among those forming budgets. Most states are expected to manage through because of accumulated reserves; and some of the larger challenges, such as having to fund a greater share of Medicaid, will be phased in over a number of years.
Not long ago, many economists were predicting weakness in the economy, and we have more recently seen slow growth in hiring while inflation remains above the Fed’s 2% target. If the economy does falter, it will be one more challenge for munis, and they may need to adjust expenses should the economy weaken.
We expect the credit quality of municipal bonds to be stable as we head into 2026 but with pockets of weakness as the myriad challenges are addressed. Our stable outlook is based on the high level of reserves at most municipalities, continued good budget management and pension funding practices, as well as a generally good economy.
Investment-grade munis are considered a safe fixed-income investment, with most issuers maintaining strong reserves to help manage through challenges such as changes in federal funding and demographics, cyber threats, and climate disasters. Munis have generally higher credit quality than corporate bonds do, with an average rating of AA compared with BBB for corporate bonds. Munis ratings span the spectrum, with larger, more diverse munis often better equipped to manage through challenges while smaller and rural munis have less flexibility to address challenges.
Upgrades continue to outpace downgrades and most sector outlooks are stable, however there are negative outlooks for a few sectors. Higher education and school districts are managing the demographics of an aging population and competition. Ports are challenged by tariffs and changing supply routes. Electric utilities are investing in aging infrastructure and will need to raise rates at a time when affordability is a concern for many and could reduce the ability to raise rates to keep financial margins from eroding. We expect larger, diverse munis and those with larger reserves and consistent budgeting to have more flexibility to manage through.
The supply of munis is expected to break another record this year, with estimates ranging from $520 billion to over $600 billion for investment in all types of infrastructure, from roads, bridges, and airports to electric power and water systems, after years of underinvestment. Debt levels have declined, with the underinvestment leaving room for additional debt issuance. The need to become more resilient is also a theme. Resiliency refers to not only hardening systems against climate-related risk but also to the need to invest in cybersecurity and AI. The market expects the Fed to ease one or two more times over 2026, so financing costs would decline and help munis accommodate more bonding.
Thoughts from David Kotok, Co-Founder & Strategic Advisor
Executive Summary
The United States’ exceptional economic dominance rests on three mutually reinforcing pillars: the US dollar’s global role, rule-of-law and institutional depth, and credible military power. In 2026, these advantages remain intact but face rising headwinds from fiscal strains, geopolitical competition, and a more contested trade order. Digital assets – especially USD-pegged stablecoins and tokenization – are likely to augment US financial leadership if regulation continues to clarify; however, poorly managed fragmentation or security failures could undermine dollar primacy at the margin. Tariffs and “economic statecraft” are reshaping global supply chains and may shift elements of the current world order – creating winners in US strategic industries but imposing volatility and cost on firms and consumers.
Bottom line: The US remains the system’s center of gravity in 2026, but the balance is less comfortable and more path-dependent than a decade ago. [federalreserve.gov], [atlanticcouncil.org], [business.columbia.edu], [cepr.org]
1) The Foundations of US Dominance
1.1 Dollar Hegemony
- Depth and liquidity of US capital markets and the legal/institutional framework sustain the dollar as the leading reserve, invoicing, and funding currency, with shares around 58% of disclosed FX reserves and outsized usage in global finance relative to US GDP/trade shares. [federalreserve.gov], [aljazeera.com]
- Dollar dominance confers an “exorbitant privilege”: cheaper sovereign borrowing and powerful sanctions reach – benefits that historically compound US economic and geopolitical leverage. [atlanticcouncil.org], [aljazeera.com]
2026 risks: Elevated US deficits and policy uncertainty (including tariff volatility) could slowly erode confidence if not managed– though hard substitutes remain limited (euro ≈20% reserves; yuan ≈2–3%). [federalreserve.gov], [aljazeera.com]
1.2 Rule of Law & Institutional Strength
- The US legal system protects property rights, creditor claims, and contract enforcement, anchoring global investor demand for dollar assets and the “safe” character of Treasuries. [federalreserve.gov], [atlanticcouncil.org]
- Institutional credibility (Fed, SEC/CFTC, courts) amplifies market depth and risk management, sustaining global trust even in turbulent periods. [federalreserve.gov], [atlanticcouncil.org]
1.3 Military Credibility
- Historical evidence indicates currency leadership tracks military leadership; the US’s unparalleled power supports safe-haven flows and reinforces financial dominance – particularly in crises. [business.columbia.edu], [cepr.org]
2) Digital Assets in 2026: Boost or Threat?
2.1 Why Digital Assets Can Enhance US Dominance
- Stablecoins are overwhelmingly USD-pegged (~99% by market cap), extending the dollar’s reach on-chain and embedding it in new transaction rails; tokenized Treasuries and dollar-denominated crypto ETPs deepen dollar usage in digital finance. [business.hsbc.com], [coinedition.com]
- A regulatory pivot – with market-structure legislation and clearer taxonomies – positions US institutions to integrate digital assets (ETPs, custody, tokenization), potentially broadening capital market access and reducing settlement frictions. [research.grayscale.com], [whitehouse.gov]
2.2 Where Digital Assets Could Threaten Primacy
- Fragmentation risks: non-USD stablecoins, CBDCs, and cross-border systems (e.g., CIPS) may circumvent dollar channels at the margin, especially in sanctioned regions or within blocs aiming to de-dollarize. [morganstanley.com], [aljazeera.com]
- Security & governance risks: Smart contract exploits, custody failures, or regulatory arbitrage could damage trust and complicate systemic oversight if growth outpaces controls. [coinedition.com], [morganstanley.com]
Net assessment (2026): With credible regulation, institutional adoption, and US tech/VC depth, digital assets are more likely to be additive to US financial leadership than subtractive – particularly via USD stablecoins and asset tokenization. [research.grayscale.com], [business.hsbc.com]
3) Trade & Tariff Policy: Effects on the World Order
3.1 Strategic Aims and Near-Term Outcomes
- 2025–2026 US tariff initiatives aim to reindustrialize, secure critical supply chains, and use tariffs as statecraft leverage to bargain for reciprocal deals; they have also generated substantial revenue (≈**$30B/month** by some estimates). [imd.org], [finance-commerce.com]
- Global supply chains are reconfiguring: US inbound volumes contracted while emerging regions gained share; firms report elevated trade compliance and planning complexity heading into 2026. [bloomberg.com], [thomsonreuters.com]
3.2 Systemic Risks and Order-Shaping Dynamics
- Weaponized trade and tariff uncertainty strain multilateral norms (WTO) and invite retaliation, increasing volatility and costs for consumers and business – especially SMEs and import-dependent industries. [imd.org], [abnamro.com]
- Key 2026 wildcards include USMCA review and potential court rulings on tariff legality – events that could reset authorities, require refunds, or trigger policy reassessment. [bloomberg.com]
Net assessment (2026): Tariffs can deliver targeted industrial gains and negotiating leverage but carry macro and geopolitical costs. The world order is more transactional and regionalized, with long-run consequences still path-dependent on policy execution and legal outcomes. [imd.org], [abnamro.com]
4) 2026 Scenarios
Scenario A: Managed Dominance (Base Case)
- Dollar remains central, with stable demand for Treasuries; digital assets integrate under US oversight; tariffs soften selectively through deal-making ahead of mid-2026 political calendar.
- Implications: Moderate growth contained inflation from tariffs, ongoing supply chain diversification, continued dollar primacy on-chain and off-chain. [federalreserve.gov], [research.grayscale.com]
Scenario B: Fragmented Finance
- Faster-than-expected de-dollarization niches (commodity settlements, sanctioned corridors); non-USD CBDCs/stablecoins gain transactional share; tariff frictions persist.
- Implications: Higher hedging costs, more bilateral settlements; modest drift from dollar networks in specific regions/sectors. [aljazeera.com], [morganstanley.com]
Scenario C: Rebalancing Through Legal/Policy Reset
- Court decisions or political recalibration limit tariff tools, prompting a partial return to rule-based trade; digital asset guardrails catalyze broader institutional flows into tokenized US assets.
- Implications: Reduced trade volatility, stronger capital formation via tokenization; reinforcement of dollar in new rails. [bloomberg.com], [research.grayscale.com]
5) Strategic Recommendations (Actionable for 2026)
5.1 Currency & Liquidity Strategy
- Anchor FX exposure to USD while preparing contingency rails (euro/yen corridors; select stablecoin usage with top-tier issuers) to mitigate settlement disruptions.
- Enhance Treasury liquidity management – consider tokenized short-duration funds and real-time settlement pilots where permitted. [research.grayscale.com], [business.hsbc.com]
5.2 Digital Asset Policy & Operations
- Adopt a “regulated-first” posture: Use qualified custodians, audited stablecoins, and products compliant with forthcoming US market-structure rules; maintain red-teaming for smart contract risk. [whitehouse.gov], [coinedition.com]
- Pilot tokenization (cash, collateral, receivables) to improve settlement speed and transparency; focus on USD-denominated instruments to reinforce core funding advantages. [research.grayscale.com]
5.3 Trade & Supply Chain Readiness
- Scenario-plan tariffs by product line and HS code; diversify sourcing to tariff-light jurisdictions and deploy trade tech for compliance and duty optimization. [thomsonreuters.com]
- Contractual agility: Include tariff pass-through, force majeure, and rapid repricing clauses; reassess USMCA exposure and anticipate possible review outcomes. [bloomberg.com]
5.4 Governance & Risk
- Board-level oversight on FX/digital assets/trade policy; integrate geopolitical risk into enterprise risk management (ERM) with quarterly refreshes tied to legal and regulatory updates. [abnamro.com]
6) Key Indicators to Watch (Q1–Q4 2026)
- Dollar share in reserves & global invoicing (IMF/ECB/Fed updates). [federalreserve.gov], [aljazeera.com]
- Stablecoin market cap (USD share) and tokenized Treasuries adoption (industry/ETF filings). [coinedition.com], [research.grayscale.com]
- Tariff/USMCA review outcomes and court rulings on reciprocal tariffs. [bloomberg.com]
- Global container flows and rerouting patterns (McCown, industry trackers). [bloomberg.com]
- Credit outlook for US sovereign and deficit trajectory (ratings statements/Fed notes). [federalreserve.gov]
Appendix: Selected Sources
- Federal Reserve (2025): The International Role of the U.S. Dollar – 2025 Edition (depth/liquidity; reserves/invoicing shares; institutional underpinnings). [federalreserve.gov]
- Atlantic Council (2025): Why the U.S. Cannot Afford to Lose Dollar Dominance (virtuous cycle of dollar & power; strategic implications). [atlanticcouncil.org]
- Columbia Business School & CEPR (2024): Research briefs on military-finance linkage and currency leadership. [business.columbia.edu], [cepr.org]
- Al Jazeera (2025): Dollar dominance outlook (reserve shares; BRICS/euro narratives). [aljazeera.com]
- Grayscale Research (2025):2026 Digital Asset Outlook (institutional adoption; tokenization; stablecoins). [research.grayscale.com]
- White House (2025): Digital Assets—Market Structure & Oversight (taxonomy; federal frameworks). [whitehouse.gov]
- HSBC (2025): U.S. Crypto Tipping Point (USD stablecoin dominance; institutional scale). [business.hsbc.com]
- Bloomberg & Reuters (Dec 2025):Trade/tariff landscape and 2026 risks (USMCA review; tariff consequences). [bloomberg.com], [finance-commerce.com]
- Thomson Reuters Institute (2025):2026 Global Trade Report (corporate responses to tariff volatility; compliance trends). [thomsonreuters.com]
- ABN AMRO & IMD (Nov–Dec 2025):Global outlook & strategic priorities (AI/geopolitics; weaponized trade). [abnamro.com], [imd.org]
John R. Mousseau, CFA
Vice Chairman | Chief Investment Officer
Feedback | Bio
Sign up for our Market Commentaries
Cumberland Advisors Market Commentaries offer insights and analysis on upcoming, important economic issues that potentially impact global financial markets. Our team shares their thinking on global economic developments, market news and other factors that often influence investment opportunities and strategies.
Links to other websites or electronic media controlled or offered by Third-Parties (non-affiliates of Cumberland Advisors) are provided only as a reference and courtesy to our users. Cumberland Advisors has no control over such websites, does not recommend or endorse any opinions, ideas, products, information, or content of such sites, and makes no warranties as to the accuracy, completeness, reliability or suitability of their content. Cumberland Advisors hereby disclaims liability for any information, materials, products or services posted or offered at any of the Third-Party websites. The Third-Party may have a privacy and/or security policy different from that of Cumberland Advisors. Therefore, please refer to the specific privacy and security policies of the Third-Party when accessing their websites.
