"GDP is a flawed number that came, I think, out of the need of financial markets for a single measure of success or failure.”
“Often when we say that GDP is growing but wages are stagnant, we are really saying that corporate profits are growing at the expense of labor wages.” -David Blond
Responding to a recent guest piece by Michael Drury, “Statistical Discrepancy: A Mystery about Profits?” (https://www.cumber.com/market-commentary/statistical-discrepancy-mystery-about-profits-michael-drury), economist David Blond sent this paper to me in which he discusses at some length the statistical discrepancy issue and how to deal with it when estimating GDP. David is founder and president of QuERI International (http://www.queriinternational.com). We thank him for sharing his perspective and insights with our readers. While this is a technical paper, please let me remind readers that the profits estimates start in the GDP estimates and translate into earnings, some of which are in the publicly traded companies on the stock exchanges. That is why we dig so deeply into this GDP “statistical discrepancy” mystery.
Here’s David Blond.
Some Notes on Drury Article on the Statistical Discrepancy: A Mystery about Profits
By Dr. David L. Blond, President, QuERI-International ([email protected])
A recent discussion from Cumberland Advisors by Michael Drury discusses the approach that the BEA takes to developing estimates of corporate profits and the relationship to GDP. In my QuERI Integrated Global Model (www.queriinternational.com) I use input-output models for 72 countries and nearly a hundred products to develop an integrated view of trade, industrial activity, employment, prices, and components and subcomponents of GDP (personal consumption [16 categories], government [10 categories], business investments [63 categories], and international trade [120-plus commodities]). Each of these broad-based indicators is integrated into the fabric of the model, and individual multi-country equations allow linkages between industrial supply and demand. The QuERI models are some of the largest and most integrated dynamic models available from any source and represent fifty years of work in trying to understand the complexity of the evolving world economy.
One of the key points Michael Drury made in his discussion of the statistical discrepancy in the calculation of GDP that may come from the measurement of corporate profits is readily apparent in the forecasting model I use for triangulating on a forecast for GDP growth in the future. Small errors in the calculation of the wage bill and even the measurement of production can change the estimates for corporate profits. Often when we say that GDP is growing but wages are stagnant, we are really saying that corporate profits are growing at the expense of labor wages. There have been periods in the last two decades when this is true, and the reported growth in GDP has come only from corporate profits growth squeezing labor to a point where, in the real economy, demand does not grow in line with the supply-side view of GDP. For this reason, when I decided, late in the model development, to include a monetary, price, and value-added model as part of the modeling sequence for the global model, I chose to look at future GDP growth from a number of different perspectives — demand, supply, and some hybrids in between.
United States GDP Growth – Multiple Views of the Same Reality
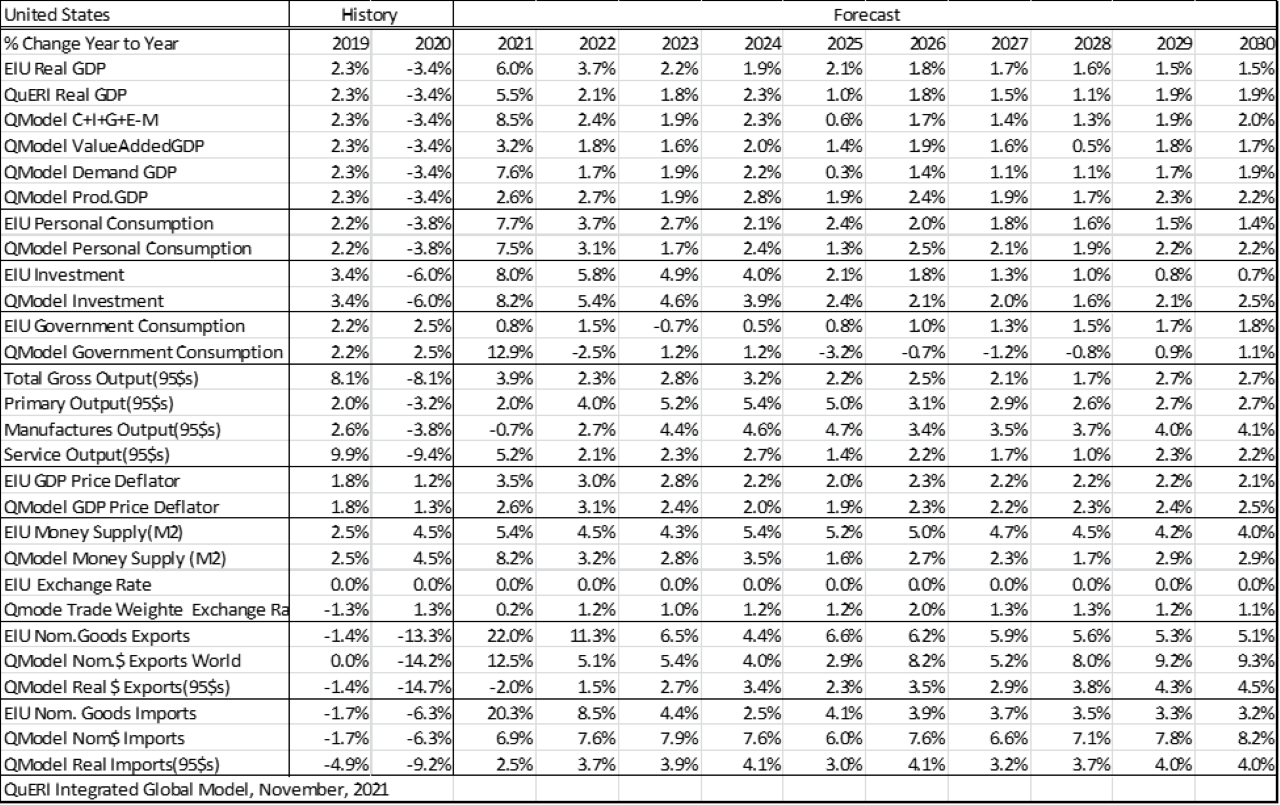
In the table below I compare GDP forecasts using different aggregates and economic variables that come from my model. The models cover all 72 countries, thus the coefficients reflect the joint relationship associated with all countries. Some differentiation is developed by relative wealth; and countries are sometimes, but not always, divided between advanced, emerging, and developing. In the QuERI model GDP is not a major variable and is rarely included in that form in the non-linear equations for industrial activity or even consumption (final demand). I rarely used it when modeling real activity of industries or even consumption patterns because it could overpower the true factors that drive demand for steel or cars or business services. Taking a leaf from quantum physics, adding GDP into equations for consumption is adding a bias to the observation of the consumption variables rate of change, a self-fulfilling prophesy that depends upon getting GDP right in the first place.
There are multiple estimates of next year’s GDP coming from different indicators:
- EIU GDP forecast is an exogenous to the system and used to compare the QuERI model to that of the Economist Intelligence Units forecast for the next few years.
- QuERI GDP is a weighted composite of the other GDP models developed by the system. It is a kind of Delphi estimate of GDP coming from different sides of the same equation – supply and demand.
- C+I+G+E-M is a composite GDP developed using the QuERI forecast for personal consumption spending, business investment spending, government spending, exports, and imports. Private consumption is split into 16 different categories of consumption, investment into 63 industry investment expenditures, government into 10 categories, and trade for exports and imports into 53 traded goods.
- Value-added is the closest to the Drury concept, for it includes the estimate of the total wage bill and the total profits to drive the dependent variable, real GDP.
- C+I+G+E-M is an additive index for moving real GDP forward in time from the individually developed macroeconomic concepts in the QuERI model; demand is an econometric interpretation that allows for weights to be developed for each of these components in a cross-country equation for forecasting GDP growth.
- Prod is based on interpreting GDP growth using subcategories of gross output – primary products, manufacturers, and services. Each of these production totals has a varying share of both profits and wage bill associated with it which is picked up by the coefficients or elasticities in the econometric (statistical) equation.
In the table below we can see how there is no single way to think about the true forecast for GDP. Gross Domestic Product is, at least in my mind, a flawed concept primarily for the same reasons that were mentioned in the Drury paper; there is no single measure of GDP that the BEA or others can determine using the statistical samples they work with. It is no wonder that every few years the entire framework for GDP is revised. A good example of this was that getting from nominal observable data to real or constant volume data is hard. Of all the things I have had to face in my nearly fifty years of building models of national economies, finding the right price determination deflators for industries and concepts has been the most difficult. How did we come up with what is Gross Domestic Product in the first place? The measure of value-added in the economy is an imperfect measure of real activity. We get good data about every five years from the industrial and service census of companies, but less real data from other sources. Much of what we think as “real” is artificial and contrived. It is a kind of snapshot of the world as crudely observed by a mix of private and public sources and even “guesstimates,” a kind of government-speak for “guesses.” Governments tend to triangulate, as I have done in my model, by looking at the conflicting statistical data they get from their surveys and trying to make sense of it. They can observe some subsample of retail sales from industry reports. They get some help from companies reporting corporate profits each quarter, but this only works for large companies and not for the millions of small and medium-sized enterprises that are well below the radar of stock analysts. In line with Drury’s observation of the possible range of outcomes if the discrepancy is as large as he thinks, so too, I get a number of conflicting forecasts when I measure GDP, as reported historically by the governments of the 72 countries in my global sample, against alternative independent factors that measure activity from the demand, supply, and somewhere in between.
What the Different GDP Forecasts Tell about the Future Path of US Economic Growth
Starting with 2021, the QuERI version of the truth is about .5 of 1% below the EIU forecast. The two demand-based estimates, coming on the heels of the recovery in the economy are very strong – 8.5% and 7.6%, while the two supply-based estimates are relatively weak — 3.2% for the value-added, based on employment, wages, and profits (this is an aggregation of over 150 industries data) and 2.7% from the production-based estimates. Why the discrepancy between these two? One possibility is that the demand reflects the additional financial support that the government spending added. The extra unemployment funds and other areas of spending might be poorly integrated within the framework of the model’s use of government consumption in the econometric models of production, employment, and macroeconomic components. The EIU forecast uses a more conventional model and “analyst”-based approach to come up with its forecasts. In the QuERI model the production-oriented models for GDP integrate some of the supply-chain and production factors in the GDP forecast. Both the production and the value-added versions reflect this weakness and thus push the QuERI 2021 forecast down below the more conventional wisdom that EIU assumes for 2021.
The next year, 2022, looks similar to the mainline forecast of a slowing economy, but the QuERI drop is far more severe due largely to the sudden drawdown of the government spending from the Recovery Act and before the infrastructure plan adds more spending into the economy. From the perspective of a more liberal-thinking economist, the QuERI result would be bad for Biden and the Democrats. A weaker 2022 would make it harder to raise prices, to be sure; but it might mean that fewer people are working. Looking at the value-added version of the GDP forecast, the drop-off is greater than in the production or demand versions. The value-added attempts to estimate the changing profits to wage bill’s share of GDP, which is not a fixed percentage but depends upon the differential between total output of an industry and the estimate of the total wage bill (the average real wage x employment). If the wages are up and employment is up and profits are down, this will reduce the rate of growth of the value-added model. Looking at the series, we see that it follows the production very well; but then in 2028, for some as yet unexplained reason, one of the key drivers falls off the cliff and we get a significant growth slowdown before recovery.
Messages in the Numbers
GDP is a flawed number that came, I think, out of the need of financial markets for a single measure of success or failure. It came at a time when collecting good industry data was hard, but getting demand side measures was easier. It came after Leontief ‘s input-output construction of the way economies worked helped to illustrate the interrelationships between supply, demand, labor, and profits in a useful, understandable way consistent with the way businesses viewed their P&L and balance sheets. Most forecasting models for GDP work with the pure demand side of the equation. It is easy to get, and there are many good leading indicators to tell a business forecaster about where the economy is going in the next few quarters. Rarely do they try to discern more than that, and for the most part because GDP tends to move in intervals close to that of previous years with a general trend that is downward sloping and, as in my Labor Supply paper, dependent as much on demographics as on government interventions. For a long while I didn’t factor in a model of GDP in the global model because I wanted to work with variables that could be useful for international trade and consumption patterns, gross output and its various components — intermediate demand, final demand, investment, government — consumption, or sales values. GDP and monetary variables in an integrated framework linking money supply to economic activity to lending rates and exchange rates and then into the separate estimates for GDP is one of the final steps in the modeling process, a kind of simple summing up to test if the basic model is performing correctly. Rather than have one version of GDP, I chose to allow for different economic viewpoints since there could easily be great differences between what the supply side says about revenues from wages and profits and what the demand side is saying is actually consumed. Adding to the complexity is the possibility of credit making disposable income difficult to measure accurately. The imperfect nature of the macroeconomic summation where exports are positive but imports negative suggests that small errors in the reporting of trade can cause major differences in the reported GDP from the government one quarter to another.
When a new quarterly or even annual GDP number is presented, it is a rough guess on the truth. There have also been problems with what is “real” output as measured. BLS’s earlier approach to measuring computers where they assumed that because the today’s computers are multiples faster than the earlier ones but cost the same amount of money, then the real value of computers as measured by constant dollar GDP must be significantly greater. Until this was corrected, we might have been seeing an economy with only computers and nothing else in the real numbers. I believe the BEA analysts triangulate to a single estimate of the quarter’s real output, again a flawed number when you think about this. What is real and what is not, how do we get volume of activity? In my model I deflate at the ISIC3 level using indicators that the BEA produces for US commodities then adjusted by differentials in country inflation rates, but what if these US commodity price indices are themselves flawed (as was the case for computers a few years back, which forced a reevaluation of the US GDP due to its underestimates for the price index with regard to computer production and consumption dominating the “real” economy).
I think a good analyst will look at the differential in the numbers for what they are — statistical variance around the central mean. For example, the drop in real GDP in 2025 is due primarily to the drop-off of the government stimulus assumed (by me) to happen as the various Biden recovery act initiatives dry up and the infrastructure plan does not add income directly in the same way. The GDP coming from real activity, the supply side, holds up in this period, slowing a little, but still positive. Thus we can talk about the future not as a single point element, but as a collection of ways we observe the future. Economists need to learn some things from physicists about Heisenberg’s uncertainty principle; the observation of the data makes the data flawed. Analysts tend to modify our model output as needed to meet our a priori expectations. Private sector economists are, as the former President of Ling-Temco-Vought explained to me when I was at the Pentagon when some observation that I made at a public meeting about the economy was repeated by someone else, “Well, son, we are all swimming in the same bathwater,” or everyone uses reflections of the truth to confirm the truth as we report it to our peers and the general public. Many of the private models are heavily add factored when the model does not reflect what they think will happen or if there is some partial observation that they think needs to be “included” in the statistical construction of the truth about an industry group (housing or automobile demand) or the overall economy (GDP, private consumption, investments, etc.).
The QuERI model is far too complicated to be adjusted easily. I assume that most of the adjustments made by people are more wishes than based on facts. When we get into looking at what will happen in individual industries — the internal workings of a model like QuERI’s — I don’t think even the companies can integrate all the factors that will result in next year’s or next few years’ revenues, except for their own company but much less for the industry as a whole. I don’t know enough about the steel industry to force it up or down because of some outside events or anecdotes that are picked up in the press, so I let the steel model tell me what the data, old and newly introduced, tell me about how demand for steel will change or how new supply will alter past trade patterns.
So when I added GDP as a concept to look at in the context of the model of the world economy, I chose to examine the pattern of future growth from multiple points of view, knowing only one thing — none of these will be the absolute truth; but, combined, they might allow me to see in murky light what next year and the years after will bring. Unlike many trended models, this version of the truth has cycles, capturing in the non-linear relationships between industry output, employment, wages, and prices, the normal give and take of a globally complex economic superstructure.
In the 1980’s I built one of the first dynamic models of global trade by commodities and between countries for forecasting ocean and air transport. I initially used a very simple model that used GDP and its components in the equations for trade. This was a DRI and DRI’s macroeconomic forecasts came out monthly and there were often four different views of the future – Trend, Cycle, Optimistic, Pessimistic – so choosing the right one was key, moreover, between the quarterly forecasts for the Sea Trade forecast the various macro groups would change their forecast sometimes radically. This created in the ocean transport forecast sometimes radical changes in the flows of products which caused clients to question – why did you get this wrong. The truth was I didn’t do anything, but the macro group did change things and thus there might be suddenly more imports than previously reported all within a single quarter.
David R. Kotok
Chairman of the Board &Chief Investment Officer
Email | Bio
Links to other websites or electronic media controlled or offered by Third-Parties (non-affiliates of Cumberland Advisors) are provided only as a reference and courtesy to our users. Cumberland Advisors has no control over such websites, does not recommend or endorse any opinions, ideas, products, information, or content of such sites, and makes no warranties as to the accuracy, completeness, reliability or suitability of their content. Cumberland Advisors hereby disclaims liability for any information, materials, products or services posted or offered at any of the Third-Party websites. The Third-Party may have a privacy and/or security policy different from that of Cumberland Advisors. Therefore, please refer to the specific privacy and security policies of the Third-Party when accessing their websites.
Cumberland Advisors Market Commentaries offer insights and analysis on upcoming, important economic issues that potentially impact global financial markets. Our team shares their thinking on global economic developments, market news and other factors that often influence investment opportunities and strategies.
