With the end of the year in sight, there are several themes in play for bonds.

Inflation
It doesn’t matter what inflation measure you prefer — all are much higher than people have been used to over the past few years. The markets were habituated to the idea of annual inflation of +/- 2%, and that expectation has clearly gone off the rails because of a combination of fiscal stimulus (direct spending), monetary stimulus (not directly inflationary but keeping interest rates low), and supply chain disruptions. As we write this, headline CPI (Consumer Price Index) is advancing at 6.8% year over year; headline PPI (Producer Price Index) is advancing 9.6% year over year; and the Fed’s preferred measure, the PCE deflator, is advancing at 5.7%. The Federal Reserve, after stating for months that this inflation was transitory, has thrown in the towel and identified inflation (as well as inflation expectations) as a problem they must deal with.
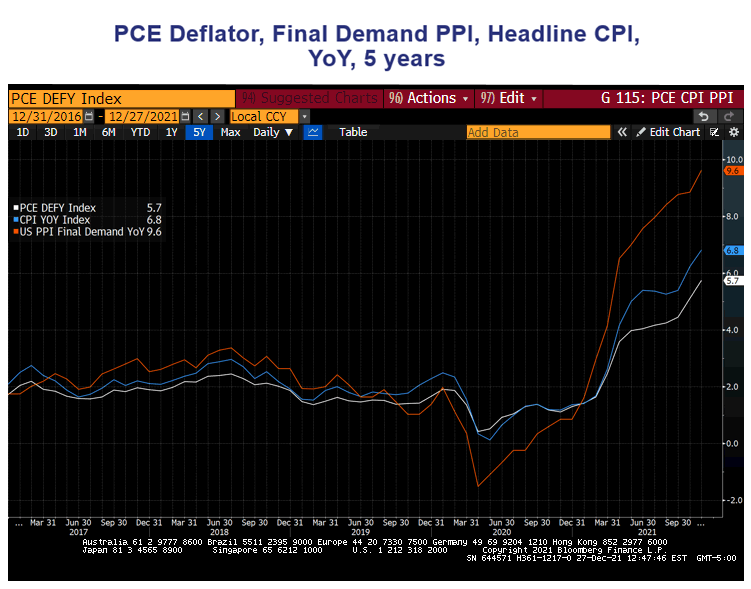
As we see from the graph above, all these measures of inflation began to turn up significantly starting eight to nine months ago. Clearly, that rise has coincided with a large part of the population getting vaccinated and starting to get out into the economy. In other words, the TURNOVER of money picked up significantly. People started to travel, flying and driving; they went to sporting events and concerts (full stadiums or venues, with ticket sales, concessions, parking etc.), or they just went back to work. Those people spent money, and the people they spent it on spent money, and so on. The least surprising thing is that we got this inflation. The significant infusion of money in 2020 and early 2021 met much faster turnover of money, and inflation has resulted.
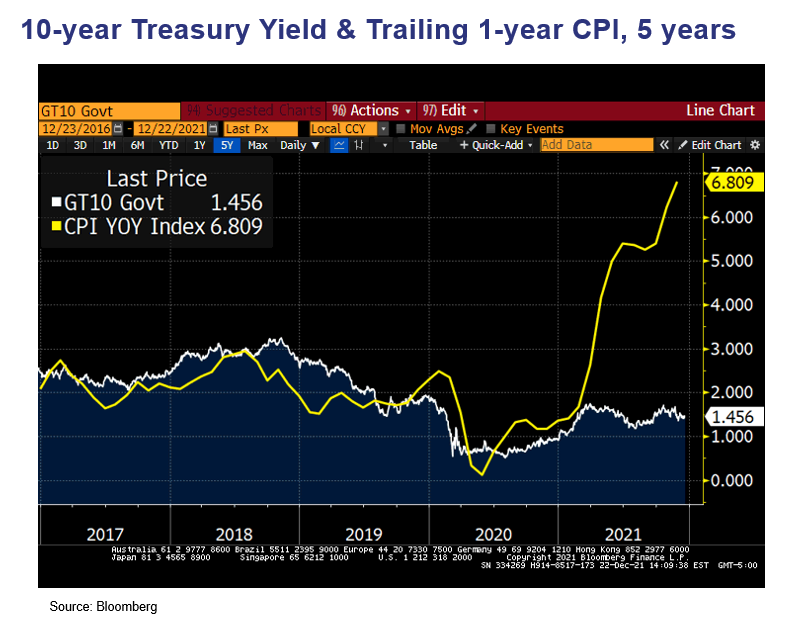
What is surprising is how interest rates have remained as low as they are. The graph above shows the 10-year bond yield vs. trailing 12-month inflation. We can see how negative REAL interest rates (interest rate minus inflation) have become.
There are multiple factors supporting this development. Though inflation has been rising, it is very clear that Wall Street traders have bought into the “transitory” theory of inflation espoused by the Fed, even though the Fed has now backed off from it. In addition, until November, the Fed had been supporting the bond markets with an unprecedented amount of monetary stimulus since the spring of 2020, including monthly purchases of $80 billion per month of Treasuries and $40 billion per month of mortgage-backed securities. The Fed recently started to pare these purchases back (tapering) and has announced an accelerated path for reducing them, so they will be finished by March 2022.
In retrospect, one must question why the purchase of mortgage-backed securities continued as it did, as housing prices are shattering records in many parts of the country, and in many places house prices for first-time home buyers are outstripping the ability of those buyers’ incomes to support such prices. As we have pointed out in past commentaries, there is usually market inertia pushing back against the first legs up in inflation. The chart below shows the US 10-year bond yield vs. headline CPI from the 1970s through early 1980s. This was a period of virulent inflation, which finally started to be addressed by the Fed in 1979 through SHARP increases in fed funds rates and short-term bond yields.
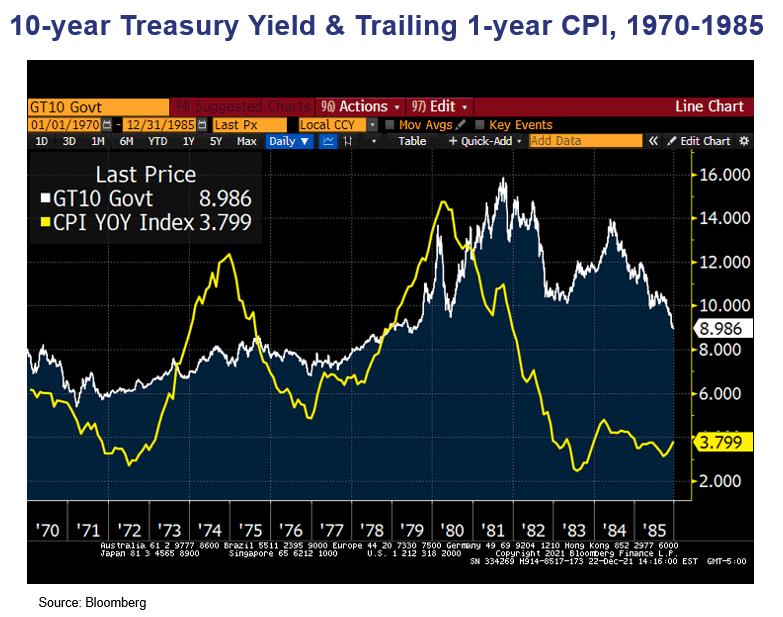
We can see that the first leg up in inflation in the early years of the 1970s was met with bond yields moving higher at a much slower rate than inflation did. We question whether this phenomenon is now being repeated.
What’s the story going forward?
We do expect the monthly inflation numbers to moderate over time. That does NOT mean we expect the year-over-year inflation numbers to head back down to 2%. More likely, the monthly numbers will level off at 0.3–0.5% instead of the current 0.6–0.8% monthly numbers. That’s the difference between a run rate of approximately 5% versus a run rate of 8.5%. Even a reduced run rate of 4–5% is substantially above the current 1.45% level of the 10-year bond.
We know the Fed’s bond-buying program will end in March. Some of this reduction in buying may be offset by less supply if the president’s spending bill does not get through Congress in some form. However, the Fed has also signaled that it is planning to raise short-term interest rates, and we expect this hike in the fed funds target rate to begin soon after tapering is completed. An examination of past hiking cycles shows that intermediate and longer-term rates do start to rise as you get beyond the second-rate hike, and we would expect that as well. And there is a larger question about the long-term secular cycle of interest rates, which has seen declining interest rate cycles since 1981. For the first time in my career at Cumberland, we now feel that a secular low was made in August 2020, at 0.5% on the 10-year bond. A secular series of cycles that are rising imposes greater discipline in managing portfolio durations than does a series of declining secular cycles.
What about munis?
|
12/31/2020 |
U.S. Treasury |
AAA |
AAA/UST |
|
2-Year |
0.122 |
0.14 |
1.16 |
|
5-Year |
0.362 |
0.22 |
0.6 |
|
7-Year |
0.646 |
0.40 |
0.63 |
|
10-Year |
0.916 |
0.71 |
0.77 |
|
20-Year |
1.442 |
1.17 |
0.81 |
|
30-Year |
1.646 |
1.39 |
0.84 |
|
3/31/2021 |
U.S. Treasury |
AAA |
AAA/UST |
|
2-Year |
0.162 |
0.14 |
0.86 |
|
5-Year |
0.940 |
0.51 |
0.54 |
|
7-Year |
1.421 |
0.77 |
0.54 |
|
10-Year |
1.742 |
1.12 |
0.64 |
|
20-Year |
2.314 |
1.55 |
0.67 |
|
30-Year |
2.413 |
1.75 |
0.73 |
|
6/30/2021 |
U.S. Treasury |
AAA |
AAA/UST |
|
2-Year |
0.249 |
0.16 |
0.64 |
|
5-Year |
0.889 |
0.50 |
0.56 |
|
7-Year |
1.236 |
0.70 |
0.57 |
|
10-Year |
1.468 |
1.01 |
0.69 |
|
20-Year |
2.018 |
1.34 |
0.66 |
|
30-Year |
2.086 |
1.52 |
0.73 |
|
9/30/2021 |
U.S. Treasury |
AAA |
AAA/UST |
|
2-Year |
0.283 |
0.17 |
0.60 |
|
5-Year |
0.975 |
0.50 |
0.51 |
|
7-Year |
1.297 |
0.82 |
0.63 |
|
10-Year |
1.498 |
1.13 |
0.75 |
|
20-Year |
2.000 |
1.47 |
0.74 |
|
30-Year |
2.058 |
1.67 |
0.81 |
|
12/16/2021 |
U.S. Treasury |
AAA |
AAA/UST |
|
2-Year |
0.616 |
0.25 |
0.41 |
|
5-Year |
1.165 |
0.60 |
0.52 |
|
7-Year |
1.335 |
0.87 |
0.65 |
|
10-Year |
1.412 |
1.03 |
0.73 |
|
20-Year |
1.887 |
1.29 |
0.68 |
|
30-Year |
1.854 |
1.48 |
0.80 |
Source: Bloomberg
From the tables above we can see what an improvement in RELATIVE pricing munis accomplished as the year went on. There were several reasons for this more expensive pricing of munis. There was the expectation of higher taxes from the Biden administration, as well as an overall improvement in municipal finances. Municipal balance sheets fortified themselves with federal money early in the pandemic and then enjoyed large sales tax windfalls as people stayed home and shopped online (and have continued to do so even as the economy reopened). As a result, though supply was high this year, it was probably not as high as it could have been. Next year, there will be infrastructure to finance (though with help from the federal government). And though state and local governments have improved their pension funds and added to rainy day funds, there will be less federal money for their coffers as we move forward. Plus, as mentioned above, President Biden’s Build Back Better program has hit significant Congressional roadblocks. While we expect a more modest plan to be proposed, the influx of federal money that we saw in 2020 and early 2021 is behind us, not in front of us. That fact most likely portends more muni supply at the margin, particularly as we move into the second half of 2022.
Another effect from the president’s bill being on hold is that there is little chance of progress in the SALT provisions being changed (raising the cap on the deductibility of state and local income taxes and local property taxes). Without this relief, it is most likely that the continued migration of residents of New York, New Jersey, and California, as well as other high tax states to lower-income-tax states such as Florida and Texas, will persist. Florida and Texas continue to see inflows at the rate of almost 1,000 people per day. This influx, of course, adds to the demand for housing and services in those states receiving people. Prices of homes in Texas and Florida are rising rapidly. That growth will most likely mean some additional bond issuance in those states to provide services.
Thus, we expect muni rates to trend higher along with taxable rates. And some of the very expensive pricing in the short and intermediate parts of the yield curve should relax somewhat, which at the very least would be some reversion to the mean.
We hope that the Omicron variant of COVID-19 that is currently wreaking havoc as it moves through the population will cause less serious sickness than previous variants have. And we are optimistic that the economy will continue to improve as we come out of an Omicron wave in early 2022. So, we expect inflation to decline at the margin, interest rates to rise at the margin, and the current high level of negative REAL rates to revert to the mean, which for now means to become less negative before they become positive.
We send best wishes to all our readers for a great wrap-up to the holiday season and happiness and good health in the New Year.
John R. Mousseau, CFA
President, Chief Executive Officer, & Director of Fixed Income
Email | Bio
Links to other websites or electronic media controlled or offered by Third-Parties (non-affiliates of Cumberland Advisors) are provided only as a reference and courtesy to our users. Cumberland Advisors has no control over such websites, does not recommend or endorse any opinions, ideas, products, information, or content of such sites, and makes no warranties as to the accuracy, completeness, reliability or suitability of their content. Cumberland Advisors hereby disclaims liability for any information, materials, products or services posted or offered at any of the Third-Party websites. The Third-Party may have a privacy and/or security policy different from that of Cumberland Advisors. Therefore, please refer to the specific privacy and security policies of the Third-Party when accessing their websites.
Cumberland Advisors Market Commentaries offer insights and analysis on upcoming, important economic issues that potentially impact global financial markets. Our team shares their thinking on global economic developments, market news and other factors that often influence investment opportunities and strategies.
