For 50 years of Cumberland’s history, we have been dealing with the subject of the nation’s debt. Our country has been in debt all its constitutional existence. Prior to the constitutional period the fledgling United States experienced its first hyperinflation with the continental dollar then issued by the newly created US. The phrase “not worth a continental” didn’t refer to a car.

This Sunday’s missive offers a superb recitation of the history and does so up to the Covid period.
Here’s a pre-Covid (2019) discussion of the national debt and the debt ceiling, from journalist Eric Reed, writing for The Street: "What is the National Debt Year by Year From 1790 to 2019?" https://www.thestreet.com/politics/national-debt-year-by-year-14876008. It's a subject that deserves continuous attention, but far too few politicians talk about it in the language of economic policy. We specifically thank Sara Silverstein, editor-in-chief of The Street, and specifically thank the author Eric Reed for permission to reproduce the article in full.
Here’s the history. Data source is the US Treasury.
What Is the National Debt Year By Year From 1790 to 2019?
America's debt has (almost) always grown. Here's a quick tour through the centuries that shows why.
Eric Reed, Feb. 26, 2019
Recently we wrote about the U.S. national debt. It's a subject that always deserves more coverage because while it's one of the most discussed policy issues in American politics, far too few politicians talk about it in the language of economic policy.
Discussion national debt is a debate that should take place in the context of interest rates, private sector crowd-out, inflation, dollar stability and the role of Treasury bonds in the global marketplace. It should consider fiscal policy, with the real costs of inaction on any policy issue weighed against the costs of a given initiative. Instead, we get macroeconomic takes on the latte factor.
Complexity doesn't make the national debt an irrelevant issue, and the scope of America's borrowing does matter a great deal. To fully understand that, we have to see how and why America's debt has grown more or less steadily since those first colonists got ticked off about paying their taxes in the late 1700s:
The First Decades: 1790–1849
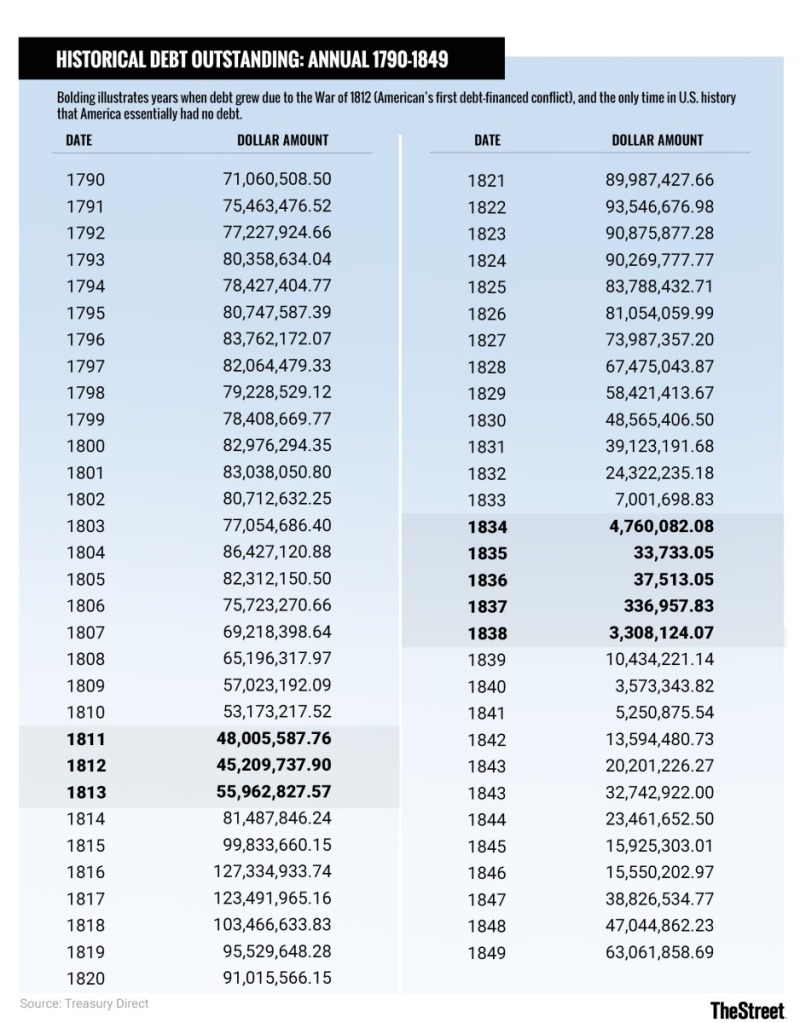
The Treasury's published records go back to 1790, but U.S. debt began with the Revolutionary War. The fledgling United States issued loan certificates to governments in Europe to help pay for the war, and by the time official reports began in 1783 owed $43 million.
Yet the system of U.S. debt didn't entirely formalize until 1790 with the Revenue Act, when Alexander Hamilton (America's first Treasury secretary) began issuing a new series of federal bonds to collect the debt of the colonies (now states) into one guaranteed federal obligation. This established what has become an essential principle of the U.S. federal system: the country has one economy with all debts ultimately secured by the national government.
It didn't necessarily have go this way. At the time Hamilton called for such action, the states owed a collective $25 million (approximately $684 million in today's terms). Given the cultural and political independence of states in early America, representatives from wealthier states could easily have objected to having their money spent on other people's debts.
America has been in debt from the first shots of the Revolutionary War, and largely for three reasons: First, running a large nation is expensive. Second, fighting wars is expensive. Third, and most notably in the beginning, the early U.S. government didn't have the power to directly tax its citizens. Until a temporary federal income tax came along during the Civil War, most of the U.S. government’s revenue came from sales and import duties.
This led to a spike in debt around the War of 1812 as America borrowed heavily to pay for its second war against Britain. Between 1812 and 1816, the national debt nearly tripled.
Then came 1835. The United States had been steadily paying down its debt from the War of 1812 over a period of 20 years. But when Andrew Jackson took office, he did so with a deep suspicion of the then-chartered Second Bank of the United States. He withdrew the federal government's 20% stake in the bank, leading to the bank's eventual liquidation in 1837 and a subsequent currency crisis that lasted for seven years.
In part because of the funds that Jackson pulled out of the bank, in January 1835, America owed essentially no interest-bearing debt for the only time in history. By the end of that year, the national debt had fallen to only about $33,700, or a little less than $1 million in 2019 dollars.
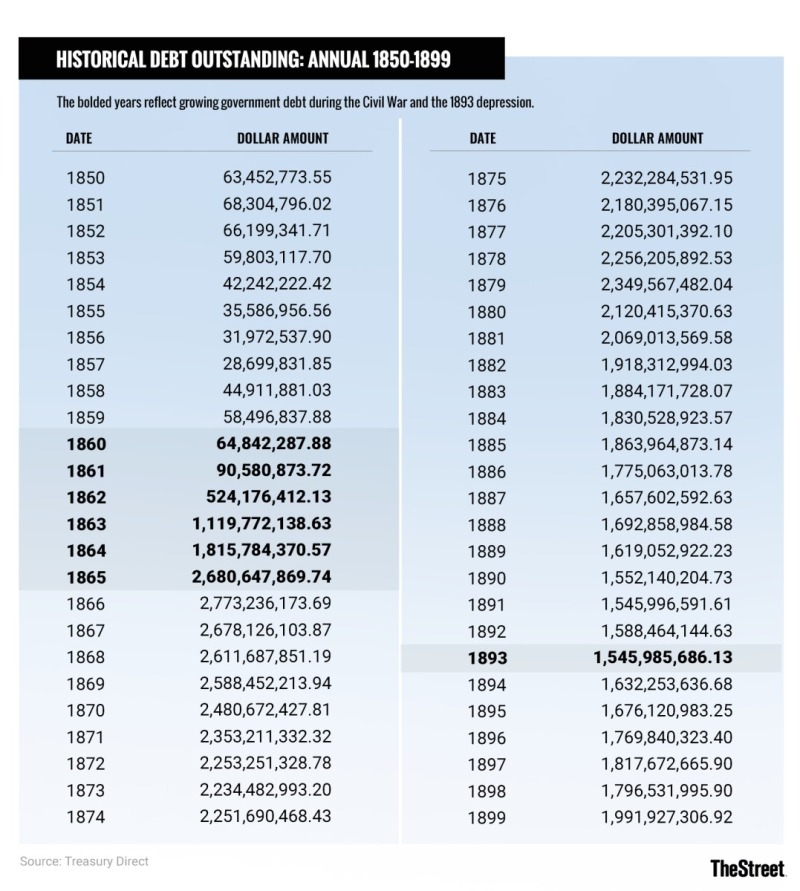
The Late 19th Century: 1850–1899
But then the Civil War happened.
Leading up to the Civil War, America fought a war with Mexico to annex Texas and California. That added more than $63 million to the national debt (a little more than $2 billion in 2019 money).
But the bigger picture is, America has never really stopped paying for the Civil War. Whether or not you approve of government debt, those five years were the first time that the national debt truly spiked.
Between 1860 and 1866 the debt rose from $64.8 million to more than $2.7 billion, approximately $42 billion by today's standards.
To keep the nation whole, President Abraham Lincoln pushed debt to nearly 30% of gross domestic product and introduced the first income tax in American history. This was the first time America would experience the one-way ratchet of debt that follows each of the country's major wars.
Each major conflict in U.S. history has been accompanied by a sharp rise in debt as the government raises funds to pay for the fighting. This wartime debt establishes a new normal, setting the baseline around which debt will fluctuate until the next major war pushes borrowing higher. In the wake of the Civil War, the U.S. debt rose to more than $2 billion and never dipped below $1.5 billion afterward, although a rapidly growing economy did quickly reduce the debt's share as a portion of GDP after the end of the Civil War.
What is also noteworthy about America's late-19th century debt is the borrowing that didn't happen. In 1893, one of the worst depressions in American history began, leading to nearly 20% unemployment by the following year. And then in 1898, America fought a brief war with Spain.
Yet neither of these events triggered the usual cycle of crisis-fueled borrowing. Instead, government debt ticked marginally down in 1893.
The Early 20th Century: 1900–1950
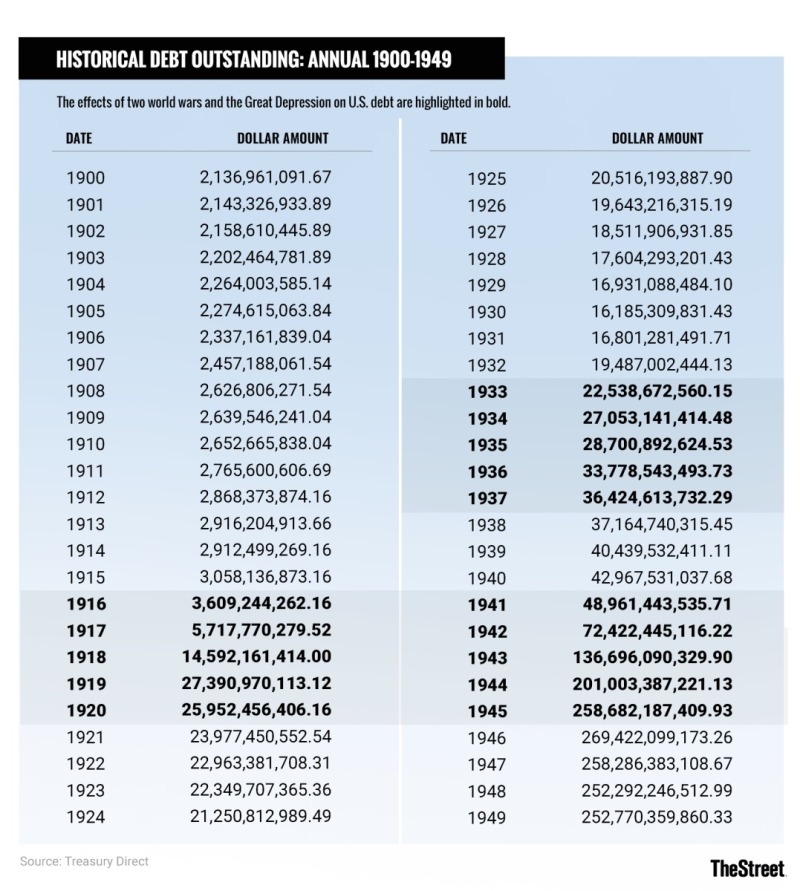
In first 50 years or so following the Civil War, the national debt generally fluctuated between $1.5 billion and $2.5 billion. But that changed quickly as Europe began to tear itself apart in 1914 in World War I.
Although America didn't join the war until April 1917, our impending involvement began to drive borrowing in the years before that. Between 1915 and 1917, the country's borrowing climbed to over $5.7 billion (approximately $112 billion in today's terms) as the country prepared for and ultimately entered war. And over the course of 1918 and 1919, borrowing soared to $27 billion and would never again end the year below $16 billion.
This borrowing also created the debt ceiling. As President Woodrow Wilson's administration needed to borrow more and more money to pay for World War I, Congress' previous approach of approving each bond sale individually became unworkable. Instead, Congress issued an overall cap, telling the U.S. Treasury how much it could borrow overall and allowing the administration to manage the sale of individual rounds of debt. This law has remained in place ever since.
Borrowing ticked up again during President Franklin Roosevelt's administration during the Great Depression. Once the New York Democrat took over from President Herbert Hoover, he began his program of vast, active spending called the New Deal. Roosevelt pushed borrowing to over $40 billion fighting the Depression -- nearly doubling the national debt when he took office.
Then, U.S. involvement in World War II pushed government spending to 43% of U.S. GDP. By some estimates, the government spent more than $323 billion fighting World War II, or approximately $5.8 trillion in modern money. Much of that money was borrowed, and between 1940 and 1946, U.S. debt climbed from $42 billion to $269 billion, much held by individual Americans in the form of Treasury bonds.
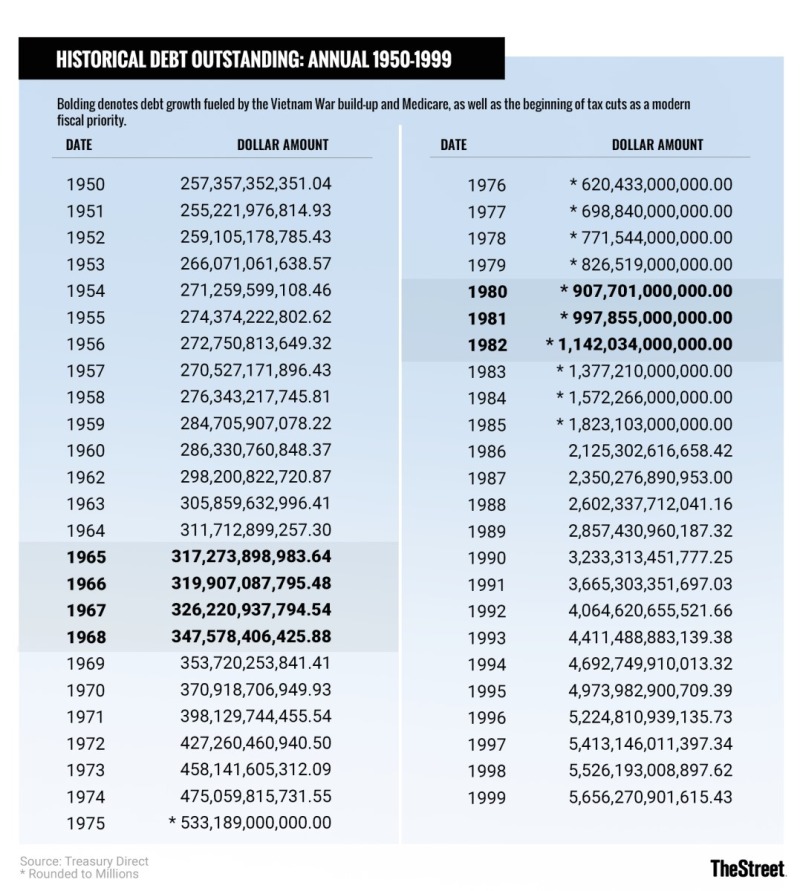
The Late 20th Century: 1950–1999
Three things happened to the national debt during the 20th century's second half -- and one thing didn't.
The Korean War simply doesn't appear in the national balance sheet. Unlike almost every other war in its history, America did not meaningfully borrow to pay for this conflict. Instead, borrowing only ticked up at a slightly above-average rate from 1951 to 1954.
But between 1965 and 1978, two issues profoundly and permanently changed America's finances. First, in 1966 Lyndon Johnson signed the Medicare program into law, creating one of the most expensive and enduring social programs in the country's history. And then from roughly 1965 to 1975, America fought the Vietnam War.
Vietnam and Korea were the first two major undeclared wars in U.S. history, and Vietnam was by far the more expensive one. Without a declaration of war to put the country on a wartime economy, Congress paid for Vietnam by increasing the national debt. Over the course of the conflict, America's debt nearly doubled, growing from approximately $317 billion in 1965 to $620 billion in 1976.
The rate of indebtedness then grew even faster under President Ronald Reagan's 1980s administration. The Reagan era introduced America's modern debate over the role of taxes in economic policy.
To this day, a significant wing of the Republican Party believes firmly that taxes must only be cut, never raised. This anti-tax approach coincided with a massive military buildup as Reagan sought to spend the Soviet Union into oblivion. By the time the Berlin Wall fell in 1989, public debt had climbed from $907 billion in 1980 to $2.85 trillion in 1989 (approximately $5 trillion in today's money). This was the first time since the Great Depression that the debt-to-GDP ratio climbed during peacetime.
Debt would generally continue to climb over the presidencies of George H.W. Bush and Bill Clinton, although the rate of growth slowed considerably after Clinton got Congress to enact tax increases early in his first term. Still, public debt ended the Millennium at $5.65 trillion.
The Present Day
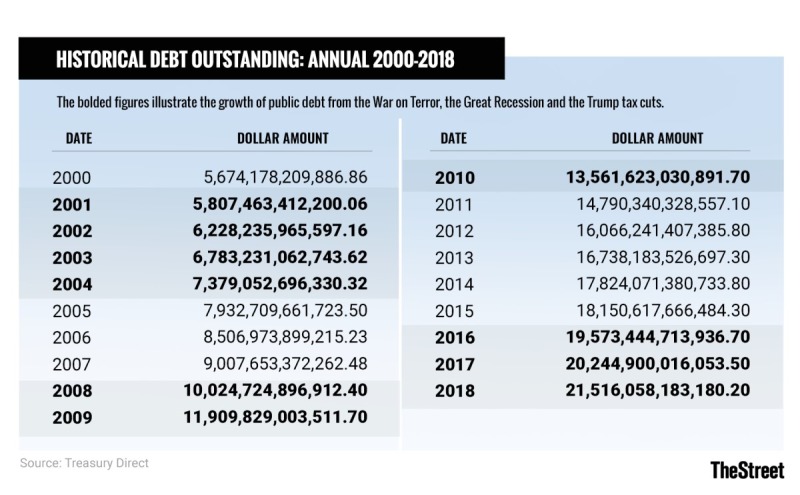
The growth of public debt slowed from $200 billion to $400 billion per year in the 1980s and mid-1990s to roughly $100 billion per year in 2001, and many observers hoped President George W. Bush would continue that trend.
Instead, two things happened in short order. First, the administration spearheaded a significant tax cut that dramatically ratcheted up deficits. Second, the Sept. 11, 2001, terror attacks quickly led to an American invasion of Afghanistan followed by an invasion of Iraq. Neither invasion was funded by additional taxes, and the national debt began growing at a rate of $400 billion to $500 billion per year.
This rate of growth was pushed to $1 trillion per year by the 2008 Great Recession as the Bush administration launched spending programs to combat the worst of the downturn's effects. President Barack Obama continued this policy. During his first term, Obama oversaw spending that grew the debt at a rate of well more than $1 trillion per year, although that rate fell by more than half later in his presidency.
But that would change again in 2018. President Donald Trump oversaw more than $1.3 trillion in new debt during his first full year in office, an amount many expect will grow as his 2017 tax cuts and some recent spending increases continue to impact government finances. As one of the largest tax cuts in modern history, Trump's tax cuts pushed corporate-tax receipts to a 75-year low and alone will likely account for more than $100 billion of new debt per year over the next decade.
We again thank author Eric Reed and editor in chief Sara Silverstein for permission to fully reproduce this history lesson.
My takeaway is that any politician (Democrat of Republican) who is blaming the other party for the debt is lying to us. This history shows it. Remember the present debt ceiling is an artificial construction originating with the Woodrow Wilson Administration for convenience in issuing debt. Prior to that the Congress was authorizing debt issuance one bond issue at a time.
Lastly, we are in the midst of a major banking crisis. It is not over.
The solution that is currently avoiding a depression-like collapse is the use of the US Treasury’s full faith and credit pledge which is accepted worldwide. The use of the debt ceiling as a politically motivated tool now impairs the ability of the national authorities to issue debt because the Congress has failed to raise the debt ceiling. So, this limit impacts all markets and adds risk to all banks. The US Treasury needs to be able to borrow when it intervenes to stop a collapse in the banking and credit markets. And certain funding domiciles, like repo or govy funds, need treasury bills as collateral.
Dear readers: if you believe in history as a guide as I do, feel free to send this to your Senator or Member of the House of Representatives. Feel free to defend the entire credit and banking system of the United States from the attacks coming from the radical alt right and the radical alt left. It’s in your interest and mine.
And while you’re add it, please imagine what the failure of Silicon Valley Bank and other banks would have looked like if it had occurred around the X-date. X-date is the date the US Treasury runs out of cash. It is currently estimated to arrive between the end of June and September unless Congress raises the debt ceiling.
Note that at Cumberland we have been repeating these warnings in videos and written form. I’m happy to have someone from Cumberland talk with any reader about potential safety precautions available for their portfolios. Just email me for more information.
David R. Kotok
Chairman & Chief Investment Officer
Email | Bio
Links to other websites or electronic media controlled or offered by Third-Parties (non-affiliates of Cumberland Advisors) are provided only as a reference and courtesy to our users. Cumberland Advisors has no control over such websites, does not recommend or endorse any opinions, ideas, products, information, or content of such sites, and makes no warranties as to the accuracy, completeness, reliability or suitability of their content. Cumberland Advisors hereby disclaims liability for any information, materials, products or services posted or offered at any of the Third-Party websites. The Third-Party may have a privacy and/or security policy different from that of Cumberland Advisors. Therefore, please refer to the specific privacy and security policies of the Third-Party when accessing their websites.
Cumberland Advisors Market Commentaries offer insights and analysis on upcoming, important economic issues that potentially impact global financial markets. Our team shares their thinking on global economic developments, market news and other factors that often influence investment opportunities and strategies.
