The positive trend of upgrades to downgrades continues. S&P reported on May 8th that upgrades outpaced downgrades by 2.39 to 1 in Q1 2019, which compares to 2.09 to 1 for all of 2018. In our monitoring of rating agencies’ actions, this trend appears to have continued in Q2. Please refer to our Q1 commentary for a more detailed discussion of upgrades to downgrades and additional trend information: http://www.cumber.com/cumberland-advisors-market-commentary-q1-2019-credit-commentary/ .

While the credit quality of municipal bonds continues to improve, the performance of the municipal market has also improved on technical factors, squeezed by high demand and low supply, and lower long-term rates. John Mousseau discusses this trend in a recent piece: http://www.cumber.com/cumberland-advisors-market-commentary-2q2019-review-total-return-taxfree-municipal-bond-the-big-squeeze/ .
Bond markets have priced in two or three additional rate cuts; however, we think the Fed will stick to being data-dependent (see What Does Data Dependent Mean? commentary by Bob Eisenbeis: http://www.cumber.com/the-june-2019-fomc/ ; and although there is recent mixed economic data, growth continues in the US. There may not be as many rate cuts as the market anticipates; so a lack of action by the Fed could cause the curve to steepen; and municipal yields, which had declined relative to Treasuries yields, could creep to higher levels.
Credit Quality
Municipal bond credit quality is higher on average than corporate bond credit quality is. Corporate ratings tend to change faster than municipal ratings do, possibly because there is more frequent and timely reporting by corporates (corporations file quarterly and municipalities annually). Additionally, as companies’ prospects decline or improve, there is a lag between when they conduct layoffs or resume hiring and when those actions affect municipalities. Now, there are signs that corporate credit quality may be turning and may presage a turnover in municipal credit quality.
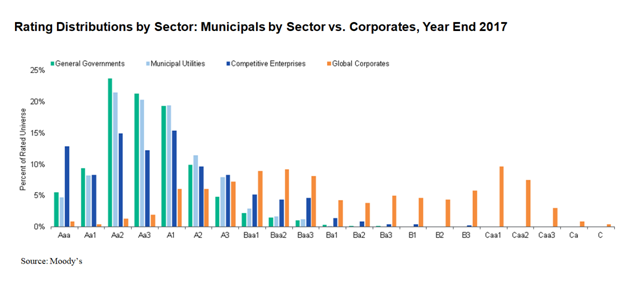
In the nearby chart, Moody’s Ratings Distribution by Sector, shows that municipal bonds generally have higher ratings than corporate bonds. The chart has the most recent published data and we expect when Moody’s publishes the 2018 chart it will show municipal ratings skewed higher in credit quality and corporate bond ratings skewed lower.
S&P Global, in its June 27 report “Trade Tensions Cloud the Outlook,” notes that downgrades, defaults, and negative ratings bias are up slightly. In contrast to state governments, which have not increased bonded debt levels, corporations have increased leverage; and some are experiencing declining margins, which have led to downgrades and could lead to more. For example, Oracle was downgraded by S&P to A+ from AA on continuing elevated leverage as a result of a large increase in share buybacks. And IBM was downgraded by Moody’s to A2 with its acquisition of Red Hat, which is expected to be strategically positive but represents increased leverage. Low interest rates and changes from the Tax Cuts and Jobs Act are helping to spur corporations to increase leverage.
Taxable municipal bonds can be a good alternative to corporate bonds, and we utilize them at Cumberland Advisors in our taxable bond strategies. We expect a continued supply of taxable municipal bonds to be available, because there are certain projects financed by hospitals, airports, universities, and other issuers that are not eligible for tax-exempt financing. Additionally, issuers can avoid the cost of jumping through compliance hoops required for tax-exempt financing; and with the present low level of rates, the difference in yield is not that great. The expected 2019 volume of taxable municipals is $45 billion, according to a Citibank estimate. This figure compares with tax-exempt volume of between $330 billion to $385 billion for 2019, according to a wide range of estimates. Although municipalities can no longer issue tax-exempt advanced-refunding bonds to refinance existing tax-exempt bonds, they can issue tax-exempt bonds to refinance Build America Bonds (BABs) which are taxable. Morgan Stanley Research in a June 10th report titled Mid-Year Supply Check-Up anticipates that $16 billion of BABs will be refunded in 2019 and somewhat offsetting that reduction in taxable supply is the expectation of $8 billion issuance of taxable municipal bonds to refund tax-exempt municipal bonds.
Budgets
Seven states began the year without a finalized budget, pointing up disconnects between factions of the government and potentially signaling governance weakness. The majority of disconnects this year revolved around educational and environmental concerns. Incidentally, the seven states have mechanisms in place to continue to operate (continuing resolution or continuing appropriation), whether by passing an interim budget or by having a law that requires the prior year’s budget levels to be used until a budget is passed. Both options may give legislators and governors relief from impending deadlines. In a report commenting on late state budgets, Moody’s notes that late budgets can reflect governance weakness and that some states are notorious for late budgets. Massachusetts is one of those states, and this year it put an interim budget in place through October, while the fiscal year began July 1. As of July 5th five states still had not passed a budget according to the National Association of State Budget Officers (NASBO). In addition to Massachusetts, the states are New Hampshire, North Carolina, Ohio, and Oregon.
Last year virtually no state budget was late – possibly because of midterm elections. The State of New Jersey passed its budget on time, for fear of a government shutdown; however, it did not do so without a dislocation. The legislature turned down the governor’s proposed “millionaire’s tax,” which some feared would push out some residents. The legislature also rejected extra deposits to the rainy day fund; however, a large payment was budgeted for payments into the pension system. As we have noted in the past, New Jersey has one the lowest pension funding levels of all states. For fiscal 2017, the most recent year for which comprehensive data is available, the level stood at 35.8% according to a June 27 report by Pew Charitable Trusts. This is the second worst level, just above Kentucky’s 33.9%, and just below Illinois’ 38.4%.
Positive economic growth projections have led to budgets based on continued expected revenue growth and increases in taxes and fees. Significantly, states have continued to bolster their rainy day funds in fiscal 2019. With the memory of the financial crisis still crystal clear, most budget proposals addressed one-time needs rather than instituting new programs that need to be funded with dedicated levels of increased revenue. There are headwinds to the positive growth, such as a potential business slowdown, possible reductions in federal aid as our national debt grows, and the demographics of an aging population, as well as looming liabilities such as pension and other post-employment benefits (OPEB) funding needs and infrastructure projects.
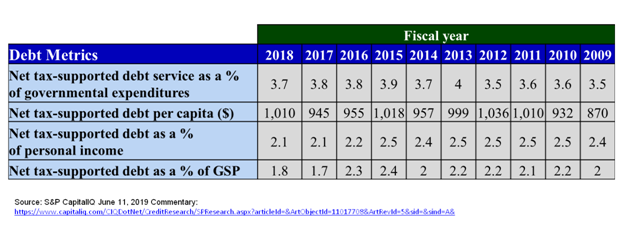
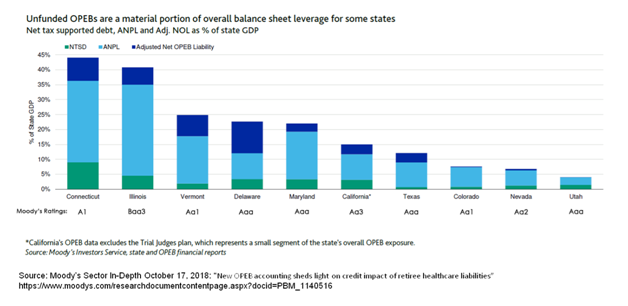
Notably, the level of state net tax-supported debt has remained essentially flat since 2012 on various measures, including as a percentage of GDP, as a percentage of personal income, and as well as a percentage of debt service to expenditures. The flat level of net tax-supported debt is due to fiscal constraints, and it may also be that other fixed long-term liabilities, such as pensions and OPEB, which are now required to be reported in financial statements, are consuming a greater share of state budgets. Waiting for a federal infrastructure plan, states delayed projects which may have also contributed to the flat debt levels. In the chart below, note states’ rating levels compared with their debt levels and the components of those long term obligations.
State Ratings and Actions
Once again there were no rating changes or trend changes in state ratings in the quarter. Although, just after quarter end, Fitch downgraded Vermont to AA+ from AAA due to lower growth prospects of an aging population. The Fitch rating is now inline with the Aa1 and AA+ ratings of Moody’s and S&P, and the trend is stable. There were however other state actions taken that can have an effect on the credit quality of state related entities or localities. On July 2, University of Alaska was put under review for a downgrade by Moody’s because the state’s budgeted payments to the university were reduced by 42%. This reduction is one among others proposed by the state to help reduce a $1.6 billion deficit and gain more structural balance. We have often noted that when states have some fiscal pressure, payments to their agencies and localities are subject to reduced state aid. Alaska is dependent on oil royalties for much of its revenue, and this revenue has been volatile and contributed to the state’s losing its AAA ratings a few years ago and to subsequent downgrades to Aa3 by Moody’s and AA by S&P.
Other examples of states restricting a local issuers’ flexibility include the State of Texas’s SB 2, which if passed would restrict local governments from increasing property taxes by more than 3.5% annually, down from 8% annually, without voter approval (there are exceptions for certain districts). Many Texas communities have been raising taxes above this level, and to the extent that additional growth doesn’t occur or reductions in expenditures aren’t implemented, financial cushions could erode.
The State of Florida passed legislation usurping the power of the Miami Dade Expressway Authority (MDX) to raise rates and build projects by replacing it with the Greater Miami Expressway Authority (GMX), mandating a toll decrease, and allowing toll increases only to meet the rate covenant, which requires that net revenues cover 1.2x debt service, while the most recent level was over 2.0x. The legislation is being challenged; and even if the challenge is successful, it is clear the entity has had its independent rate-setting authority compromised.
Transparency
The Governmental Accounting Standards Board’s (GASB) Statement 91 will require municipalities to disclose debt that was sold in its name as a conduit for another entity and the amount of debt service the municipality is likely to pay. Sometimes a municipality issues debt on behalf of another entity, usually in relation to economic development. The obligation of the municipality to pay for the debt can range from no obligation at all to partial or full. Sometimes the underlying borrower can’t or doesn’t pay, and the municipality could lend its help. This information is required to be reported for fiscal years beginning after Dec 15, 2020. This level of disclosure is intended to make government officials and taxpayers aware of potential claims that may arise. It also increases transparency for investors.
GASB continues to work on projects to improve transparency for taxpayers, issuers, and investors and is currently accepting comments on proposed reporting for public-private partnerships (P3 or PPP) and concession agreements with private partners. There continue to be political and practical reasons for municipalities to engage in P3, for example to achieve economies of scale or a large upfront capital commitment; so the focus on these arrangements and how they are presented in financial reporting is welcome.
At Cumberland Advisors we closely follow state and municipal credit developments and related news items, incorporate them into our views of the economy and markets, and employ them in our buy and sell decisions. The majority of our municipal bond holdings, both taxable and tax-exempt, have AA ratings, generally reflecting diverse economic bases and strong financial performance.
