The third quarter was marked by a rise in interest rates across the entire yield curve, particularly on the short end as the Federal Reserve continued to raise short-term rates in their battle to slow inflation. The end of the quarter saw Hurricane Ian, a ferocious Category 4 hurricane, bordering on Category 5, deal a lethal blow to southwest Florida in general and the Fort Myers, Cape Coral, and Naples area in particular.

As we write this on Thursday, September 29th, we are still digesting the devastation delivered by Ian to the state of Florida. Cumberland Advisors is based in Sarasota; and though the area had damage, it is minor compared to the destruction to the south. There are large swathes of infrastructure that will take months if not years to replace. As Ian has moved across the state, Orlando is experiencing flooding from the back side of Ian, and it strengthened again in the Atlantic and barreled into the Carolinas as a reconstituted hurricane. Loss of life and the almost incalculable loss of property in the storm’s path are still unknown. The human impact is devastating.
From previous disasters we know that the economic impact is severe and portends a big downshift in the economy of southwest Florida and also the state. We know areas rebuild, building codes are strengthened, and cities recover. And that activity produces a positive economic impact. But for now, we are sorting out the human impact, the economic impact, and the credit impact. My colleague Patricia Healy, Senior Vice President of Research at Cumberland, will be posting a piece that focuses on the municipal bond impact — both current and prospective.
The storm in the bond markets has also continued, with the Federal Reserve continuing to hike short-term interest rates to battle inflation as well as inflation expectations. Here is the change in rates since the end of the 2nd quarter.
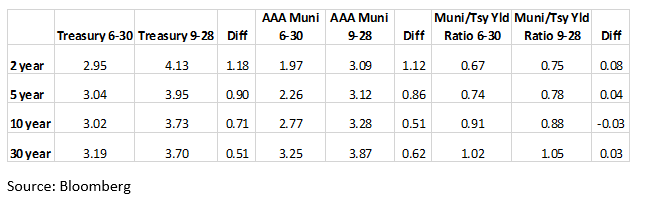
What we glean from this data is a bond market that spent the quarter in retreat. This was as much from the tough talk of the Federal Reserve as it was from the jolt of a high August CPI core number of 0.6. That combination spooked investors, and bond yields sprang higher, led by the front end of the yield curve. We do think that the Fed raises another 75 basis points but will be interested in their language after the next meeting. Whether we look at housing prices, commodity prices, inputs to commodity prices, energy, or various surveys, they all point to an economy slowing down. That includes the inverted yield curve. The difference between 2-year yields and 10-year yields moved from -7 basis points at the start of the quarter to -40 basis points at the end of the quarter. The negative yield curves don’t forecast recessions — they cause them, as banks cannot borrow short and lend long and make a positive spread, so they start to curtail credit. Recently, the difference between 10-year Treasuries and 30-year Treasuries also turned negative. The last time we saw that was in early 2000 as the Fed was then also raising rates, trying to cool the red-hot tech equity market. They did. With a vengeance. Longer-term bond yields dropped during the second half of 2000, and the front end went back to a positive slope.
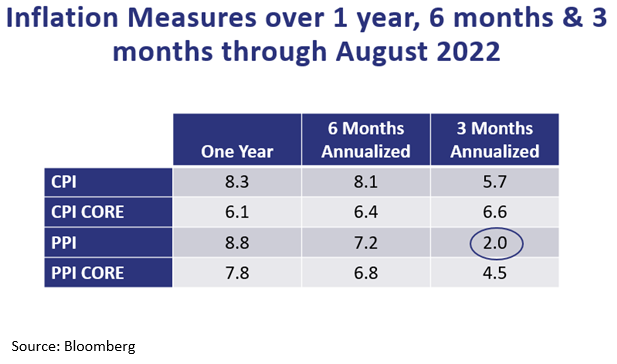
Below is a chart of 12-month inflation numbers, 6-month inflation numbers annualized, and 3-month inflation numbers annualized. As you can see it is mixed, but for the most part annualized inflation numbers are coming down — particularly PPI. And we know that producer prices tend to affect the CPI. Our current view is that inflation should subside, and in many sectors it is already doing so.
Muni bonds remain particularly attractive and long bonds even more so. This is because municipal bond funds continue to see outflows — not as vigorous as last June’s but still heavy. We have recently started to see 5% yields on some long bonds in muni bond deals. You have to go back to the taper tantrum of 2013 to see that. And at that level it represents a 1.35 yield ratio to treasuries as well as almost an 8% taxable equivalent. We think that is a heck of a bargain.
Please pray for Southwest Florida.
John R. Mousseau, CFA
President, Chief Executive Officer, & Director of Fixed Income
Email | Bio
Links to other websites or electronic media controlled or offered by Third-Parties (non-affiliates of Cumberland Advisors) are provided only as a reference and courtesy to our users. Cumberland Advisors has no control over such websites, does not recommend or endorse any opinions, ideas, products, information, or content of such sites, and makes no warranties as to the accuracy, completeness, reliability or suitability of their content. Cumberland Advisors hereby disclaims liability for any information, materials, products or services posted or offered at any of the Third-Party websites. The Third-Party may have a privacy and/or security policy different from that of Cumberland Advisors. Therefore, please refer to the specific privacy and security policies of the Third-Party when accessing their websites.
Cumberland Advisors Market Commentaries offer insights and analysis on upcoming, important economic issues that potentially impact global financial markets. Our team shares their thinking on global economic developments, market news and other factors that often influence investment opportunities and strategies.
