David L. Blond, Ph.D, has a distinguished career in international economics and particularly on the issues of trade. He is the president of QuERI-International, Washington, D.C.
He has assessed President Trump’s Tariff and Trade barrier initiative and has articulated some strong opinions. His views are his. They are worth reading and considering in what is about a ten page paper on this subject. Readers may note the documentation and data depiction which are his work.
When it comes to the views of a number of us at Cumberland you can find them here at www.cumber.com/category/market-commentary/.
We thank David Blond for permission to offer his paper to our readers.
A rebuttal to David Blond's commentary has added to the conversation. You can read that here: Why David Blond is Wrong on Trade
David R. Kotok
Chairman and Chief Investment Officer
Email | Bio
Winners and Losers from Global Trade
In a grand effort to change the subject of the political discussion from Russia to something else, President Trump fired the opening shots in a new trade war. Not content to destroy the solar industry by adding costs without adding supply to solar panels, or making South Korean washing machines more expensive without making American consumers more willing to buy US made (with foreign parts) machines from the one remaining American producer, President Trump fired off the big guns to try to save what remains of the US steel and aluminum industries with new tariffs. The response was, of course, expected.

Over the past twenty years or more I’ve tried to slow the steady erosion of the US industrial base against the tide of history, but right now, at this time, it is far too late to stop what is the inevitable shift in the global distribution of manufacturing. To have saved the US Steel industry we would have had to force US companies to invest in the new furnaces and the US steel workers to cut their wages in a vain effort to gain advantages of scale and compete on price. Our companies chose not to try to fight against the subsidies – from government direct aid to massive amounts of nearly free capital – but to regroup around a few, higher profit, subspecialties. Steel has become highly specialized in more technology interesting and profitable alloys, leaving the lower end, construction steel and non-specialty steel to foreign producers with their massive scale economies. The cost of this change has been, felt, in the secondary industries that transformed commodity steel in small operations scattered across the industrial rust belt. The downstream industries have failed as the few remaining US steel companies with specialized products have maintained their shares. The US Aluminum industry also has made changes that allow it to maintain its position in the world while fulfill its obligations to the environment. Less aluminum for cans, but more for aircraft and even military vehicles has left the industry largely with the same share of the world as it had in the past.
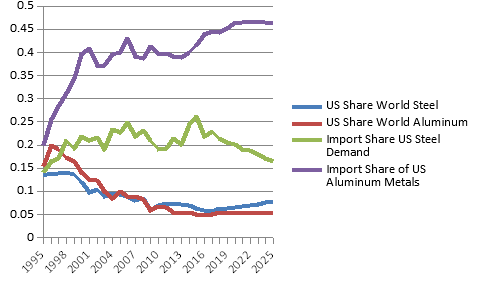
Looking at the chart we can see that while the US lost its nearly preeminent position in both industries that it had coming out of the Second World War over a long period of decline. Over this period the US companies shifted capital from less productive to more productive and profitable industries and also invested overseas. The failure of US capitalism has been borne by the workers and the communities that have been damaged by this neglect. Social morays matter and US capitalism with its emphasis on shareholders value rather than that of all stake-holders is to blame, but what we see today, as the graph illustrates, is a slow erosion, but not the disappearance of entire industries.
In the chart all values have been corrected for changes in prices and in changes in exchange rates. The US share of world output of steel and aluminum metals stabilized around 2010. In the case of US steel the import share is forecast to decline relative to demand for steel in US manufactures as the product mix changes. There is also some growth in import share in non-ferrous manufactures demand. Tariffs will not suddenly return either industry to health. Based on the factors driving consumption the import share of foreign aluminum will likely continue to increase as overall demand shifts from aluminum to more exotic low weight materials like carbon fiber while the foreign aluminum may continue to be imported for low value uses such as cans and other commodity materials made of aluminum. Again not all aluminum is the same for all uses and American companies remaining in the industry have shifted to the higher value output. This is a natural progression as we should see as countries move towards more service and information/science intensive specialties and away from the high impact on the environment and low skill product categories within the industry classification code.
What Happens If Trump Gets His Way on Trade
Global trade patterns have been modified over the last fifty years by a series of trade agreements. Largely tariffs in the richest and most important markets are low enough to be barely noticeable in most manufactured commodities. Tariffs against emerging markets have been reduced through special efforts by advance countries to open potential flows to help in the development process. Efforts to reduce tariffs have been, as a result, concentrated on eliminating tariffs on agricultural commodities with limited results since food, unlike manufactures, is one of the essentials to guarantee along with shelter to a people. Much of the progress on reducing tariffs has concentrated on reducing prohibitive tariffs in the emerging and developing country markets.
America has been at the forefront of this effort. But tariffs and non-tariff barriers not just rules for companies to deal with, they are also part of the nation’s foreign strategy. The Trans-Pacific Partnership Agreement was less about tariff levels and more about maintaining long-term trading and political connections. The failure of President Trump to see America’s role as the essential nation for global cooperation is a problem. His rhetoric has damaged our standing with our natural trading partners. But in this article we are looking less at the political and social implications of the failure to keep the momentum going, and more at how difficult reversing the trends that have reduced American manufacturing in some sectors. The reason for this is that industrial capacity has been lost in many industries and technology has made replacing suppliers far more complicated. When I was the Senior Economist at the Pentagon and studying our capability to expand rapidly our defense industrial base, this problem of technological interplay became readily apparent. A landing gear on an F-15 takes at least a year to produce even as the labor hours may be just a third or less of that time. Each time a cut is made in the high tensile alloy, the unfinished billet had to be slowly heated and slowly cooled to release the tension to allow more machining. The unique parts used on military aircraft had to meet mil-specs that made it costly to replace one supplier or open a second source without testing of the replacements. The same is true for much of what passes as new products. While consumer goods might be easier to copy, the margins on these make the cost of the new factory expensive. The advantage of Asian suppliers was not just their low labor costs, but their excess, flexible, engineering and manufacturing capabilities that are not easily duplicated. America’s manufacturing capacity has not declined even as employment in manufacturing has collapsed. Productivity explains most of the loss of jobs , but gains in productivity have come from the inclusion of more foreign sourced inputs in finished products thus real gains in productivity may be an illusion induced by this shift from a vertical to horizontal company organizational approach. The result is that fewer workers are needed as the foreign labor inputs once made in-house or with locally sourced suppliers is not counted when measuring total factor productivity. This pattern of hollowing out companies is likely responsible for most of the gains in productivity and fewer workers producing products for sale domestically.
Measuring the Cost of Anti-Globalization
Simulations are one of the few ways to measure the cost of retreating from the world that has emerged from the steady advance of trade liberalization. As we have shown, the benefits and the costs of this advance are not evenly shared opening the door to protectionist sentiments. But reversing the course also comes with costs. The QuERI Integrated Global Model measures this interconnectivity through a series of equations linking trade with production. Statistically based, econometrically derived, equations reflect the production function including stock of capital to labor ratios, and two major trade components – imports which are in nearly all cases negative to domestic production and exports which are positive. In rare cases the positive export elasticity is greater than the negative import one. Unlike most macroeconomic model for a single country, the QuERI model set is based on a 72 country and 25 year sample of data that allows for countries to pass through various stages of economic development. Lastly results are linked together across industries using input-output linkages and across the world using international trade relationships. Like the best econometric models, the coefficients are related to one another independent of prices and exchange rates. The underlying QuERI data set is likely the largest and most fully integrated long-term reading on industrial, trade, employment, prices, and consumption patterns available anywhere in the world.
The question at hand then is what would be the impact of a full blown, 1930’s style, trade war. The tariffs President Trump has initiated against good advice will not lead to a recovery in US manufacturing or in the core industries he’s targeted. As I said at the start, the train left the station long ago, and it is too late to reverse the integration, only to slow it, adding risk, rather than supporting faster growth in all countries. A model like the QuERI model, however, can be used more selectively to measure the effect of tariffs on a single industry or on a collection of industries. In the example below we want to not pick any one industry, but rather to assume that all countries apply the same tariff increase across all products. We can then measure two things – the impact on exports and imports and the impact on production.
A 10% Tariff Increase – the Global Implications
Integrated global supply chains are not simply between advanced countries and emerging markets, they also exist between countries in each group so any disruption is a major change and can lead to loss of irreplaceable capacity and capabilities. The cost of qualifying a new supplier is often high and the risk to existing business increases if the replacement products are more prone to error or failure. In this example we assume that the imposition of a 10% tariff in the United States creates a chain of causality that expands so that a similar tariff is applied in all other countries. The goal is to find out what the costs of this kind of modest increase in international prices pose to trade and production.
The broad based assumption is that globalization reverses slightly as a result of this added cost for imports. The impact is greatest within the group of advanced country due to their greater integration with the world. The calculated impact is based on the point elasticities for imports and export prices against changes in trade. To insure that we are not over or undercounting the effect we average the total export adjustment from the model and the total import adjustment for each ISIC3 commodity. The share of global trade adjustment is based on the share of the adjustment in individual country imports or exports against the average global trade adjustment. Not all countries are sensitive to changes in price for trade goods. We assume that higher prices will not increase imports although it is possible there is some precautionary trade influenced higher prices. When the price elasticity for imports is positive it suggests that demand is not sensitive to price changes. The assumption of the model is that these changes are modest and it is likely that temporary reductions can take place if the price shoots up too rapidly to be accommodated in the overall cost function for the finished products. The price sensitivity of a country on a rapid development trajectory, like China, is less than for advanced countries with more flexibility of supply or simply to reduce domestic production and import more of the finished manufactures for resale and rebranding (common practices).
Emerging and Developing Nations Came to the Party Late
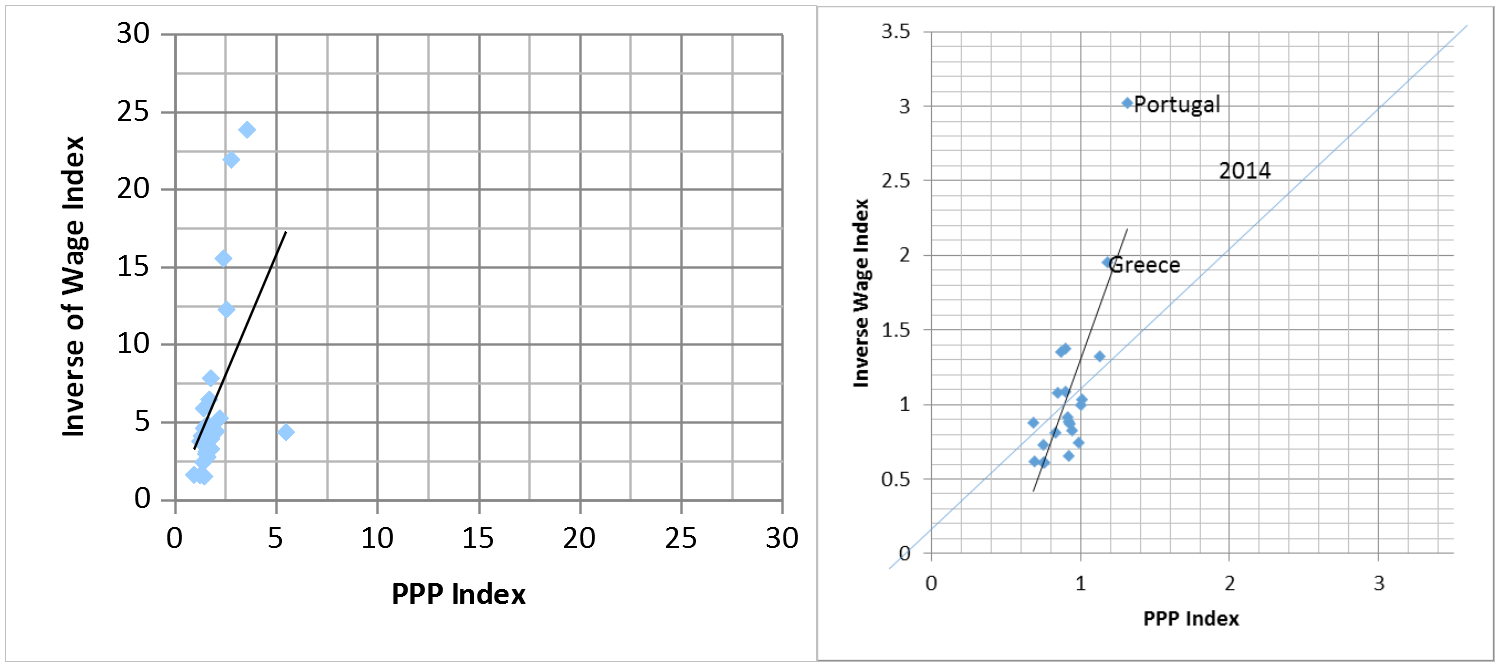
The pooled-cross sectional model for trade and industry used in my model is based on a “stage of development” so that countries at the start of period of rapid industrialization are assumed to follow paths similar to more advanced countries. In the early stages a country is more dependent on foreign sources of supply. The actual volume of imports is defined by the countries capacity to export or attract inbound foreign investment. Tariffs in these countries tend to be supportive of local business and often are higher than they need to be and these limits can impede real growth and development. Much of the theoretical literature on tariffs is based on the assumption that tariffs dampen imports, but may limit the growth of domestic industries despite the intent. The higher prices for the locally manufactured products may limit the market size and limit growth of the economy as a whole. It was factually true that in the early periods of industrialization the advanced countries had high tariffs to encouraged industrialization. That strategy is not replicable despite the fact that globalization as it stands has failed the emerging and developing nations primarily because the price of finished goods is influenced by the higher prices of the advanced countries. Thus the steel that might have gone into an automobile is priced at the world market prices consistent with the costs of finished products sold in advanced countries. For a country to grow rapidly then wages and prices have to be in line. Today the cost of living in rich and poor countries is often significantly different. We measure these differences through the purchasing power parity index. The cost of living in China is today around .33, while the wages paid to workers even at $ 5.00 an hour (2016) is just .13 of the wages in the United States. In the next graph we see how the advanced countries prices and wages generally are in line so that growth can be sustained from domestic demand and supply alone if need be.
Why is this critical – without a strong alignment between real wages and real prices then internalized, self-initiated, growth is difficult to be maintained without external sources of demand. Export-led growth encourages the import of new technologies while suppressing wages and encouraging the import of foreign luxury goods suppressing local supply. The result is that for many emerging and developing countries there is no simple solution and higher tariffs may not encourage the development of domestic sources of supply. Of course there are exceptions—protection of agricultural products may be important for reasons of the keeping peasants on the farm and insuring that domestic producers continue to stay in the rural communities and maintain food self-sufficiency.
In the charts we can see how the wage rate, represented by 1/wageindex (1.0 = US wages) and the PPP Price index are not fully in line in the emerging markets group. It costs less to live in China than the United States, but the wages in the United States are in line with the cost of living, the wages in China today are suppressed by the need to be competitive on world markets by international trade, so it is hard to sustain growth without exports or government subsidies. If that were not the case then the index for wages and the index for prices would be equal to one another.
Using the Model to Measure the Impact of Tariffs on Trade –the Cost of Reversing Sixty Years of International Trade Liberalization
The QuERI Global Model has a number of advantages when measuring the impact of changes in prices, in this case, ad valorem tariff changes, on trade, industrial activity, and employment. The two charts illustrate the disconnect between relative wages and relative prices. Globalization has widened this gap in rich and poor countries alike. At the same time the dependency between countries for vital raw materials, energy supplies, and intermediate inputs has increased. Disturbing markets and plans can only lead to a disruption in an economy until companies and economies adapt. But during the period of adaptation production is impacted, employment growth reverses, and real wages may decline further as companies attempt to maintain profits.
Trade and Industrial Production Linkages
Within the model there are a number of links between trade and production. The industrial production of traded products includes a variable reflecting the foreign content of factor inputs based on estimates from the QuERI IO models. Foreign content is based on the import share of apparent consumption times the total factor input. For example if to make a car in the United States it takes $ 1000 worth of steel based on the IO column coefficient at the intersection of steel (selling) and automobiles (buying) and if import share of foreign steel is 50%, then $ 500 is allocated to foreign content of steel. Going further down the column of the IO for automobiles we see the share of electronics is $ 1500 and the foreign share of imports of these products is 65% then the foreign content is $975. Adding all of the foreign content value up the total import value is used as an independent variable in the industry production function for automobiles. Repeating this process we can calculate then the likely sensitivity of the industry to the replacement of foreign with domestic sources of supply. In the US the foreign content share for automobiles is 40% of the total value of automobile production. For footwear the foreign share is over 78%. For China the foreign share of production for automobiles is just over 5%. So in any trade war who’s domestic companies would be more seriously impacted?
Reducing foreign inputs to US production will slow growth or even reverse growth in US manufactures so long as substitutes are not available. Given the complexity of much of what is sold as factors of production or as finished goods in retailers, replacement of foreign content will be a slow, painful and possibly impossible process. Adding tariffs will in the short-run reduce demand as some American production may be lost. In the model then the production function has three elements whose interplay determines if production will increase or decrease.
(1) Net Change in Production = Net Change in Foreign Content $ + Net Change in Exports – Net Change in Imports.
(2) Net Change in Exports = function of Impact of Foreign Tariff Changes on US Exports (positive)
(3) Net Change in Imports = function of Impact of US Tariff Changes on Imports (negative)
President’s Trump’s idea that a tariff might reduce or eliminate or dependence on foreign suppliers is a myth born as much out of ignorance as political calculation. The American manufacturing base has been hollowed out and is a part of the global supply chain of global companies with markets in all parts of the world. Fifty years of continuous efforts to reduce tariffs have been successful creating a world market and worldwide production system. But the emergence of China and its low cost wages and lower cost capital and ideal location in the heart of an emerging Asia has changed the balance. Higher tariffs will end up damaging the American economy more than China. The foreign content in US manufacturing, investment goods purchased, and consumer products sold by retail and wholesalers makes any effort to disrupt trade self-destructive. The next table illustrates this in the starkest terms – the share of foreign content in US domestic manufacturing has been growing year by year. The share of foreign content in US investment expenditures for machinery and equipment has also been growing over this period. Any effort to enter into a broad based trade war would lead to the destruction of American industries ability in the short-run to manufacture almost anything except, perhaps, rubber mats for automobiles.
Foreign content in finished products is significant. Clothing and apparel 71% in 2015, household operations 48%, furniture, finishing and other equipment 37%, other transportation and communications 48%, medical care and health including pharmaceuticals 45%, entertainment and cultural expenditures 48%. Place tariffs on imports from China and in the short-run there will be empty shelves and limited consumer choices in the stores, ultimately small and large stores will close leaving millions of people from warehouse workers to sales people out of work.
[caption id="attachment_40667" align="aligncenter" width="300"]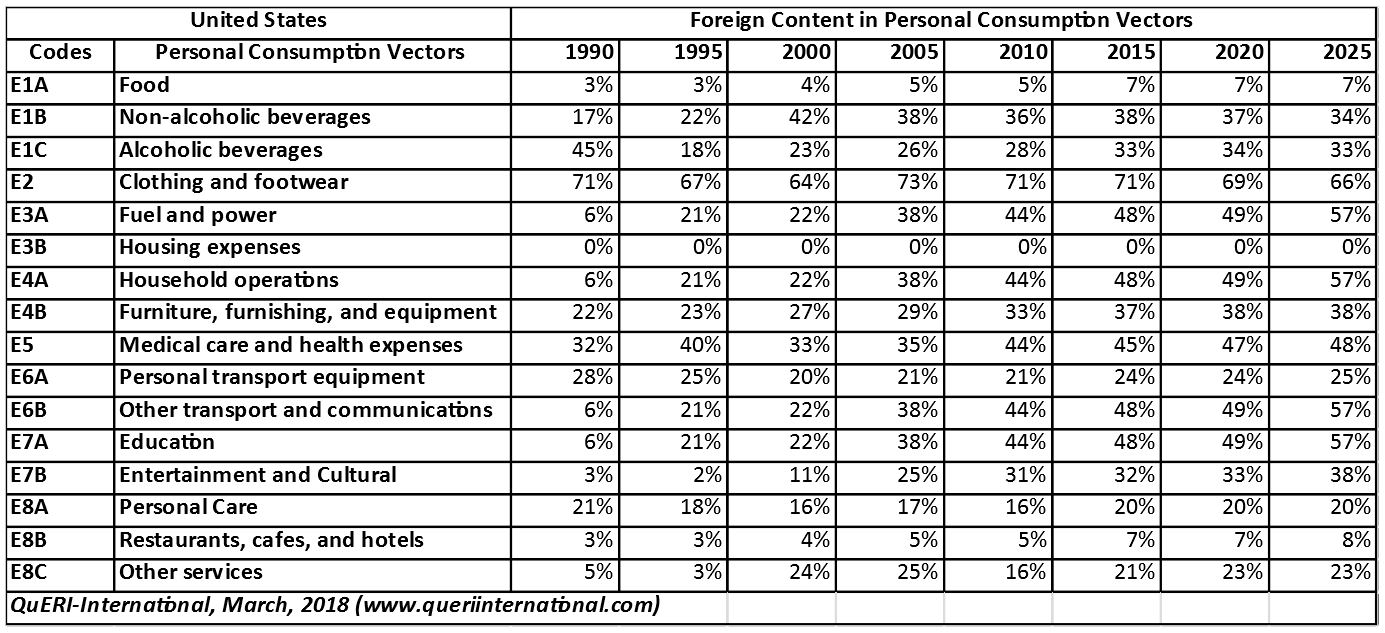 Foreign content in finished products is significant.[/caption]
[caption id="attachment_40665" align="aligncenter" width="250"]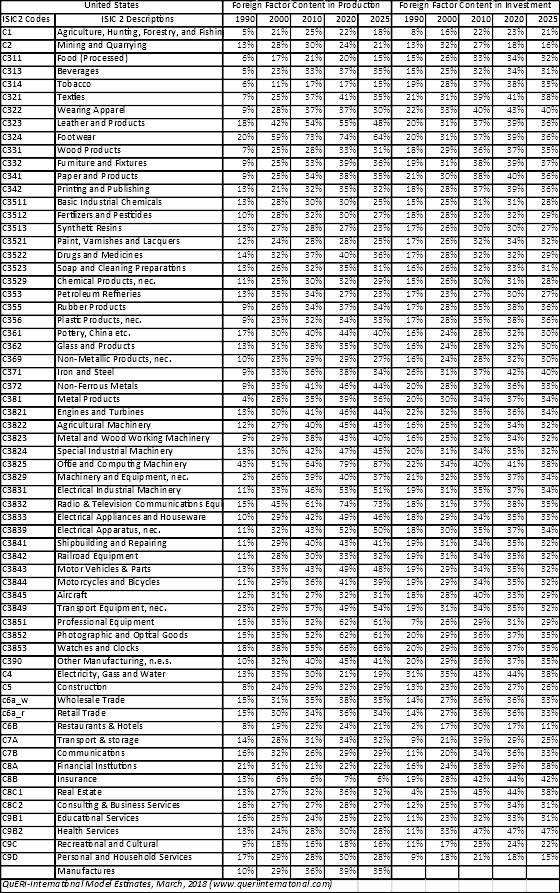 Foreign content in finished products is significant.[/caption]
Using the model we can simulate how a 10% change in tariffs as measured through a 10% change in import price will impact the world economy. In this example the 10% unilateral change in US tariffs – pushing them up to closer to 12 to 14% from around 2 to 4% where they currently are. In this scenario we assume that the world reciprocates and applies a similar increase in cost to imports from all sources. If globalization is the problem and its impact on countries ability to manufacture has been substantial, then we should expect that the change is universal, the beggar thy neighbor approach usually leads to higher tariffs across the board worldwide. The question we ask – who wins and who loses from this change. The degree of dependence, however, varies and the weights of imports and exports vary in all countries. The net impact then will be different for rich and poor, trade intensive and trade neutral countries.
[caption id="attachment_40668" align="aligncenter" width="300"]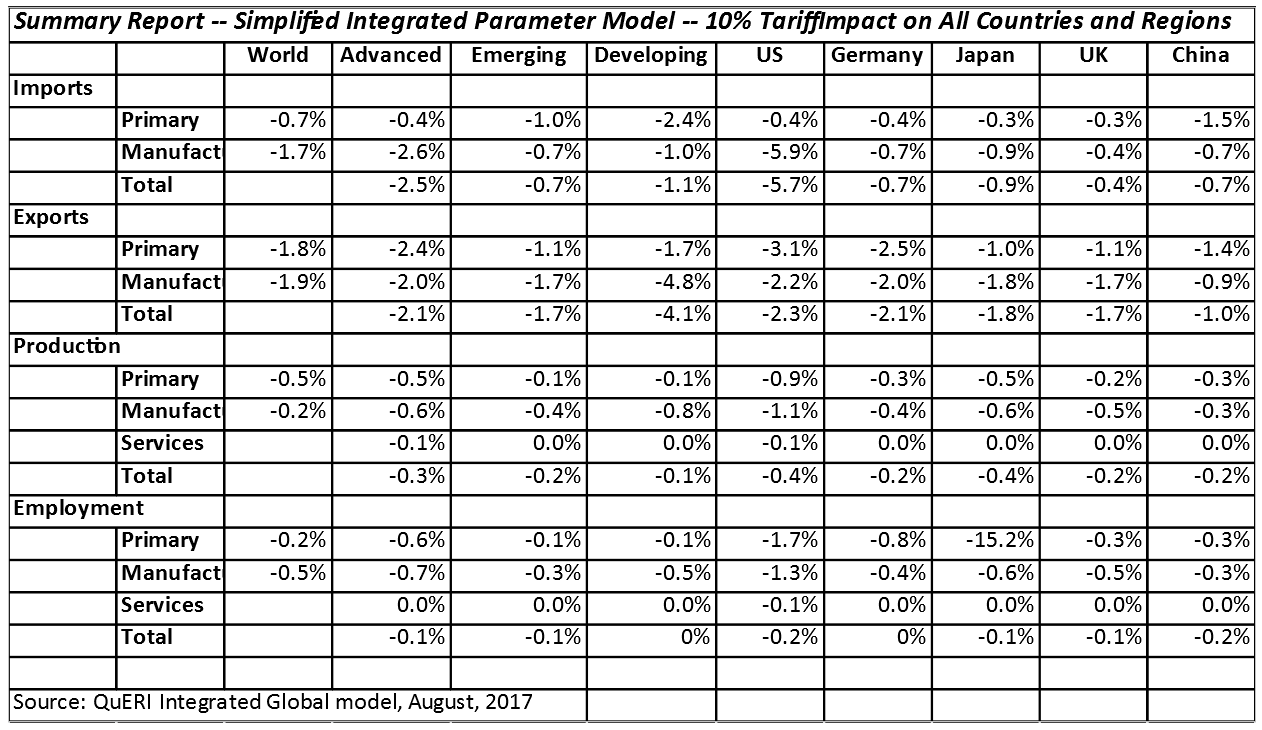 10% Tariff Impact on All Countries & Regions[/caption]
As table shows if there is a trade war and it settles down to around a 10% increase in tariffs levied against all countries imports and exports, given the dependency, the impact of this symmetrical war (unlikely as countries will more selectively target the industries and countries imposing the added tariffs) which does not bias the impact against one country and not another, the United States with its greater dependence on foreign imports will be more directly impacted than other countries. The differences in shares between US and Germany are a function of the mix of products imported and not from differences in the product specific price elasticities. The cost of President Trump’s trade war for the United States could be a 1.1% decline in real production of manufactures, a nearly 1% decline in output of primary products including soybeans and corn exports. The most important loser from any trade war is the United States. Imports would be 5.5% less while exports would be 2.2% less so that the net trade deficit could be smaller as a result of the tariffs. It would cut around 1.1% from US manufacturing output and reduce employment in manufactures by 1.3%. These results are the build-up from the bottom-up at the industry level (more than 170 industries including services).
This modeling exercise only takes into account the impact on production from the reduction in imports used as intermediate inputs to production. A more complete analysis will use the full inter-relationships within the model to measure the effect on production of less foreign products for sales to consumers and less capital goods able to be deployed to growth productive capacity. It is likely that given the significant, sometimes 30 to 50% shares of foreign content for personal consumption and business investment that the full effect of a trade war will be greater. Perhaps more damaging is that the war would be concentrated against a single country, the United States, while other countries and groups of countries maintain their past trade relationships. Like dropping out of the Trans-Pacific Partnership, threatening to pull out of NAFTA, canceling negotiations on the European US trade agreement, the net result will be to isolate the United States from the world.
Benefits and Costs of Global Specialization – How to Measure Trade Displacement.
Much of the debate over the past years about the benefits and the costs global specialization, primarily the rapid advance of China as a major manufacturing center has been less about the financial costs – the $ 12 trillion dollars of additional liquidity that the US consumers offered to the world (the cumulative US trade deficit from 1990 through 2015 compared to the over $ 3 trillion dollars in trade surplus run-up by China over this same period—and more in terms of the jobs lost and the impact of foreign products on American wages in manufacturing.
The flow of US dollars has is the lubrication for the world economy adding liquidity to rich and poor countries alike. Without the US acting then as the little blue engine that ‘could’ for the world economy, the miracle that has lifted a billion people from poverty to wealth or near wealth could not have happened, it came at a cost to America’s massive, post-war, industrial base. It came as a benefit to American consumers and companies (and investors) in the form of supporting a higher standard of living at a lesser cost than internal resources alone could support, and a better margin on sales for companies supporting the growth in the stock market values of companies even as old name companies in commodity type industries such as steel and aluminum suffered.
There are many ways to measure the trade deficit. The nominal deficit is driven by differences in relative prices of exports and imports. A price index is an approximation of the changes in the price of the components of the commodity group. The BLS, the government agency that develops price and wage indices based on surveys, but there are some major product groups where absolute prices have declined even as the capabilities offered for these prices have increased. For example computers and chips available are multiples of prior computers and chips in terms of capabilities for the same basic prices paid in the past. In the BLS indices for these technology intensive products prices are assumed to decline so real value increases. This potentially distorts the relationship between nominal and real deficits. Another problem comes from exchange rates which vary over time distorting the real value changes from the nominal cost changes. Our primary focus then will be, like in the case of macroeconomic models, changes in real activity with price changes and exchange rate changes excluded.
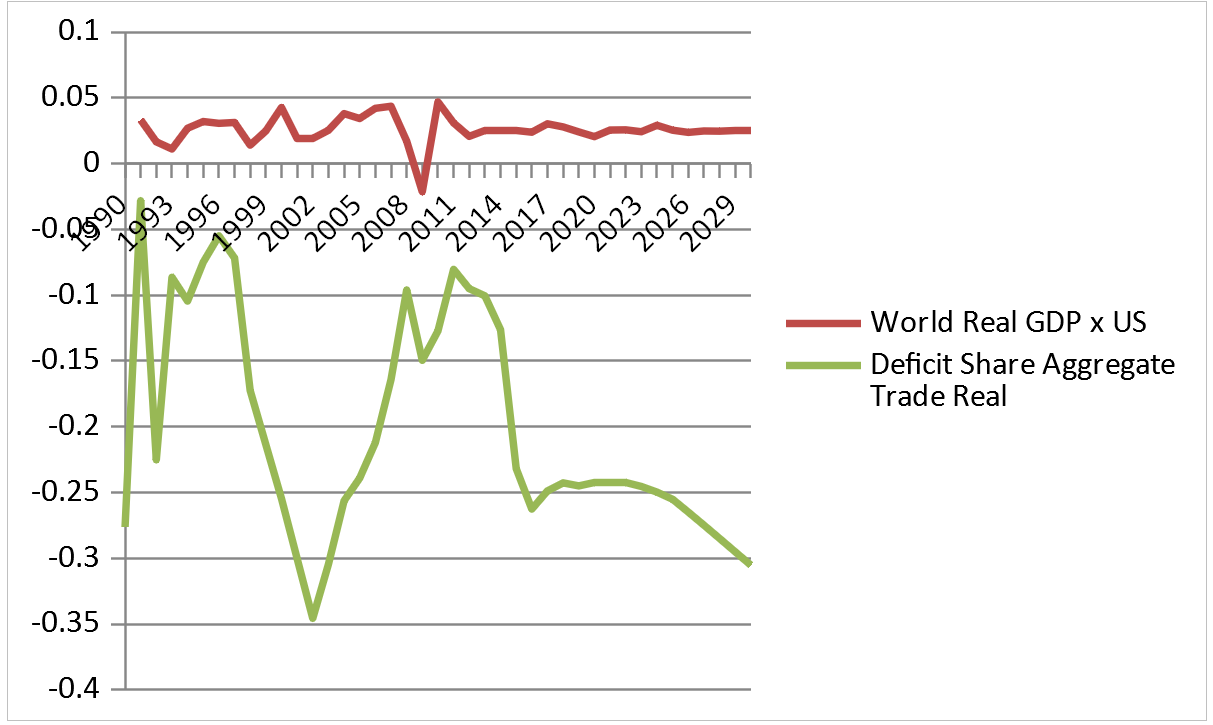
With the dollar as the numeraire currency through which much of world trade flows, the need for dollars is great. If the US fails to run a large trade deficit each year, the cost of buying and selling dollars would necessarily increase leading to higher costs to support the larger amount of world trade that is dependent upon using dollars for the transaction. Dollars are also needed to repay debts denominated in dollars or support other financial flows. The following chart perhaps illustrates that there could be a causal link between the size of the US trade deficit in constant dollars as a share of total US exports and imports and the rate of change in world real GDP output excluding US real GDP growth. The Asian crisis that sent the Emerging Countries into a tailspin and collapsing stock markets over the 1997-99 period may have been due to a liquidity shortage as the US deficit pushed towards closer balance starting in 1993 and reaching an apex in 1996 with world output (excluding US) for three years between 1994 and 1997 was 3%, but as the US fiscal stimulus from our trade deficits declined over those years, and without alternatives to replace the extra liquidity, raw material prices growth collapsed and world output slowed dramatically from 3% to 1%, and 2% in the following year. Fearing a global depression, the Clinton economic team combined with the Federal Reserve stepped in to stimulate growth in US trade and the US deficit grew strongly as world trade growth reached over 10% and the deficit reached a low point of -3.5% while world output growth expanded strongly until as the US deficit relative to total trade declined year by year until we reached the Lehman Brothers in 2007-08 and world output suddenly went from positive to negative in one year. The US recovery has been followed by a return to past periods of the US running trade deficits. In the QuERI model, like non-US world output, these stabilize in the long term at around -25% and world output stabilizes in the 2-3% range.
If the global growth depends upon the US running a stable, long-term, trade deficit, then the industrial base in the US will necessarily suffer from a shortage of demand or a steady drum beat of competition that keeps real wage growth in check. In short we may be locked into a damned if we do and damned if we don’t pattern. When I was at the Pentagon during the period of the Reagan build-up, I would explain to the critiques back in 1982-84 that economies have a natural structure that may adjust over time as defense contractors shift resources form military to civilian needs, but no economy can adjust fast enough to accommodate a sudden cessation of demand without dire consequences. Thus the world depends upon US surplus demand. The Chinese government would gladly burn the excess reserves in dollars than spend them in buying US steel or aluminum. The demand for dollars is greater today than when the idea was first suggested back in the 1970’s. The dollar is not just the transaction currency for trade, but more importantly the transaction currency for world debt denominated in dollars. The failure to provide sufficient excess liquidity shrinks the amount available. It drives up the price of the currency, but even a strong dollar and a growing trade deficit will add enough free exchange especially if the US domestic demand increases from a stronger economy.
Renegotiating Trade Agreements Doesn’t Add Industrial Capacity in the United States
I pointed out in an earlier paper on the future of globalization, that there is nothing that President Trump has said or tweeted about the failure to protect American manufacturing from the ravages of unfair trade practices of some countries or the willingness of American companies to outsource supply to foreign subsidiaries at the cost to historic relationship with workers and communities. I have been saying for years. But I’m enough of a realist (or powerless) to know that these business decisions can’t be easily reversed. Once a company chooses to leave, shutters a factory, lays off workers, then the capacity is gone. If it is reformed it will be with more capital and fewer workers or a new advanced product no longer able to be built in an old style plant. The US government owns vast reserves of machine tools in massive factories built during World War II and no longer needed. When I was at the Pentagon I visited many of these factories mothballed except for a few, new, style machines doing what work remained. The private sector is less forgiving and older plants simply rust away or is torn down to build track houses(1).
Everything in the Republican plan for rebuilding American manufacturing hinges on stimulating investment in the US. In theory this should reduce demand in real terms, but in practice it may not. The significant share of foreign content in US made manufactures today – well over 25% in nearly every sector. A stronger dollar may come from the effort to protect US companies. If the trade deficit declines and if there is a surge of foreign investors taking advantage of the reduced tax burden and the threat of more American protection, then the stronger dollar will make imports cheaper and exports dearer, limiting the effect of the Trump-Republican plan for protecting US industry from foreign competition. It is the expected future strength of the dollar that make US exports uncompetitive in more markets and the less cost to foreign imports that changes the trade balance from negative to positive in dollars but adds to the problem caused by the real trade balance that impacts employment.
Don’t Mess with What’s Working – Mr. Trump, Do No Harm
We can measure the trade deficit in many different metrics. A more interesting approach to measuring the trade deficit or surplus is in terms of the total loss or gain associated with the intermediate inputs that are not included in the export and import data. If the United States or any country could make everything needed to manufacture all the products without trade it would be autarkic (standing alone). To make a car you need, however, the contribution of other companies selling the steel, plastic, engine parts, and even consulting services. If we add these indirect sales in we have a total full-in trade value for exports and imports. In the table following we summarize the impact of the trade balance on the United States economy including the direct and indirect trade and the total number of jobs in manufacturing and in other industries lost as a result of the deficit. The cost to the economy is just 3 million jobs.
[caption id="attachment_40670" align="aligncenter" width="195"]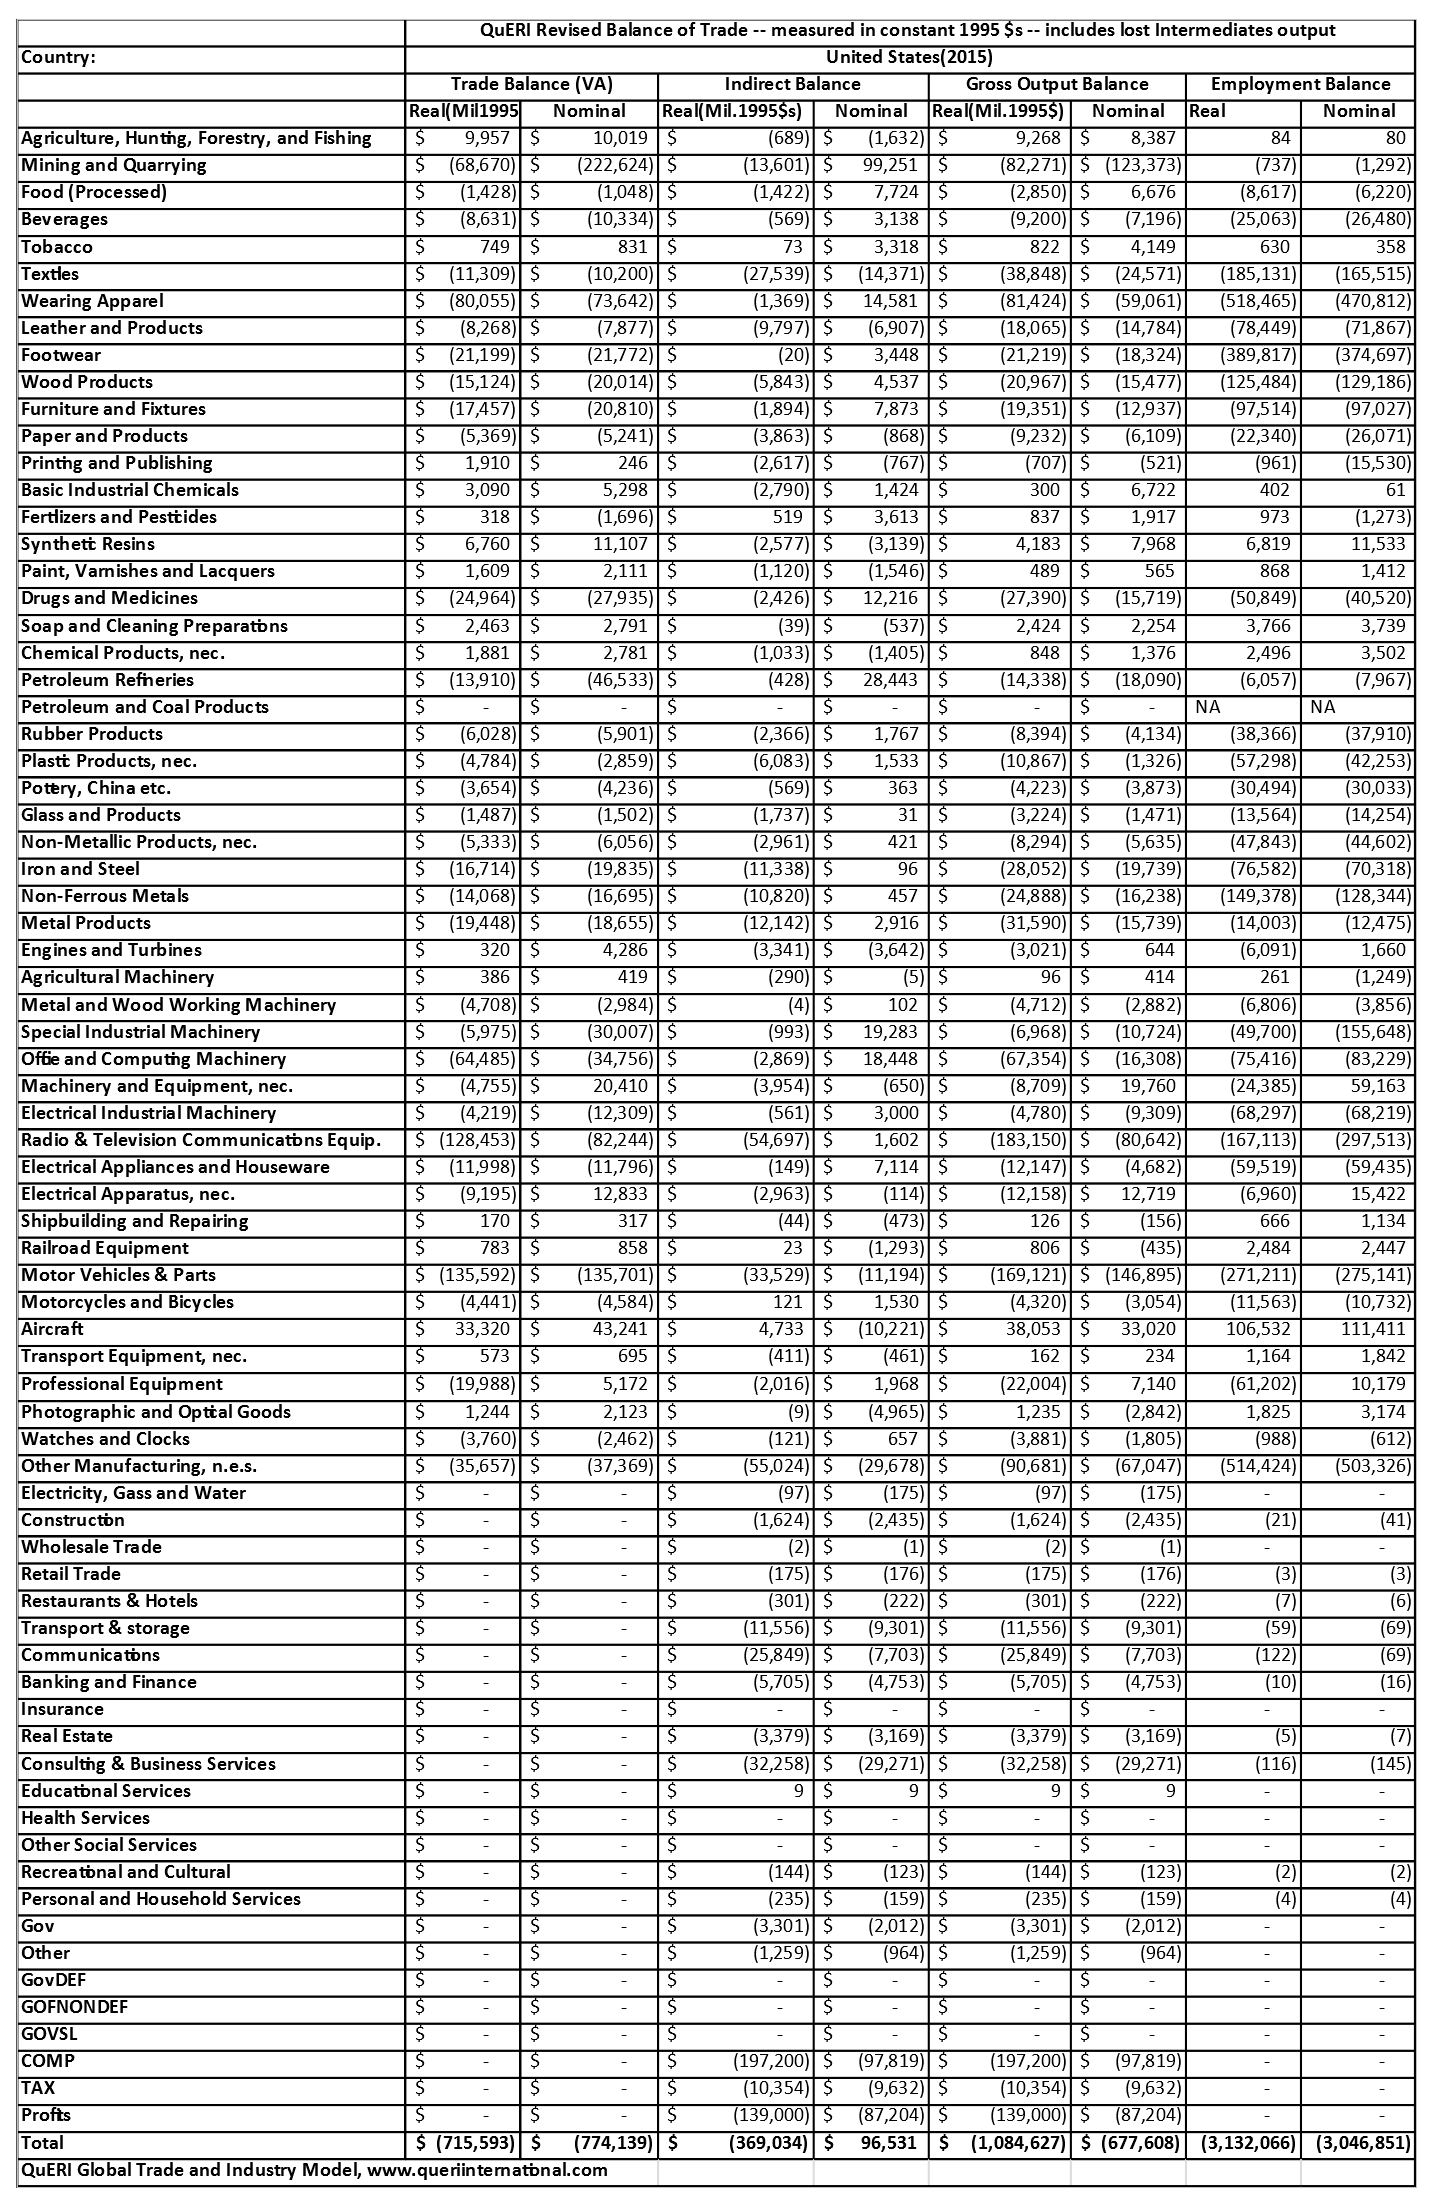 Revised Balance of Trade[/caption]
A Trump-like world view of “America First” might assume that everything you need should be made here. If the rest of the world assumed the same then we can measure the “Shadow” deficit or surplus by including the indirect or intermediate sales that are lost when an automobile is imported from Germany. As is indicated in the table following this one, the actual share of foreign content in US factor inputs that can be traded across borders is 35%. For purist, however, full independence from the world would mean that everything that is made here comes from here. The other side of the same coin is that US exports are zeroed out. Adding in the indirect sales the size of the deficit increases in the case of real trade, but actually decreases slightly in nominal terms. The difference is which industries benefit from the alternative. When all this is translated, industry-by-industry into employment losses due to the trade deficit the cost is around 3 million jobs. This works out to 2.2 employees per million dollars in deficit.
Productivity versus Trade – Where Did the Manufacturing Jobs Go?
Productivity is a dual edged sword, it gives with one hand and takes with another. In November 2002 I published an article in The Manufacturer titled “The Double Edged Sword” dealing with the give and take that comes from productivity improvements:
“We live in a world where efficiency is God. Magazines -- even The Manufacturer --glorify the benefits of “lean manufacturing”, yet productivity growth is a double-edged sword. It gives to some and takes from others. We are caught in a jobless recovery (2003-4) caused, in part, by the down side of productivity improvements in manufacturing and business services – over supply, low prices, and lay-offs.”
Unlike manufacturing in many other advanced and emerging markets, the share of traded goods in the United States economy is less than in other economies. Two forces are at work here – the United States economy has shifted towards a service intensive economy faster than others with specialization allowing efficiency gains as in-house or vertical parts of the production process are outsourced to more efficient or lower cost suppliers (some owned by these same companies and others at arm’s length). The second force is the specialization within the supply chains, breaking production into more sub elements with each of these made by companies with unique technologies or lower cost labor and capital. This means that the last step in the manufacturing process may be done in the United States but the inputs come from outside. The labor used to make these inputs is not counted in the employment totals with the labor associated with managing a worldwide supply chain (the non-traded goods inputs and the management costs) included. The output or domestic sales are the total sold so the full factor productivity is higher. For a country with a healthy export of these factors of production to other countries the traded good share of production is higher as these companies are being directed in their production by the firms they supply to and who sell their products.
In the tables following we see the share of traded goods in the United States versus some of its major competitors and then the foreign content share. In general China’s traded goods share is higher than for the United States while its foreign content share of traded goods is less so that a trade war will hurt the US more than it will China.
[caption id="attachment_40671" align="aligncenter" width="244"]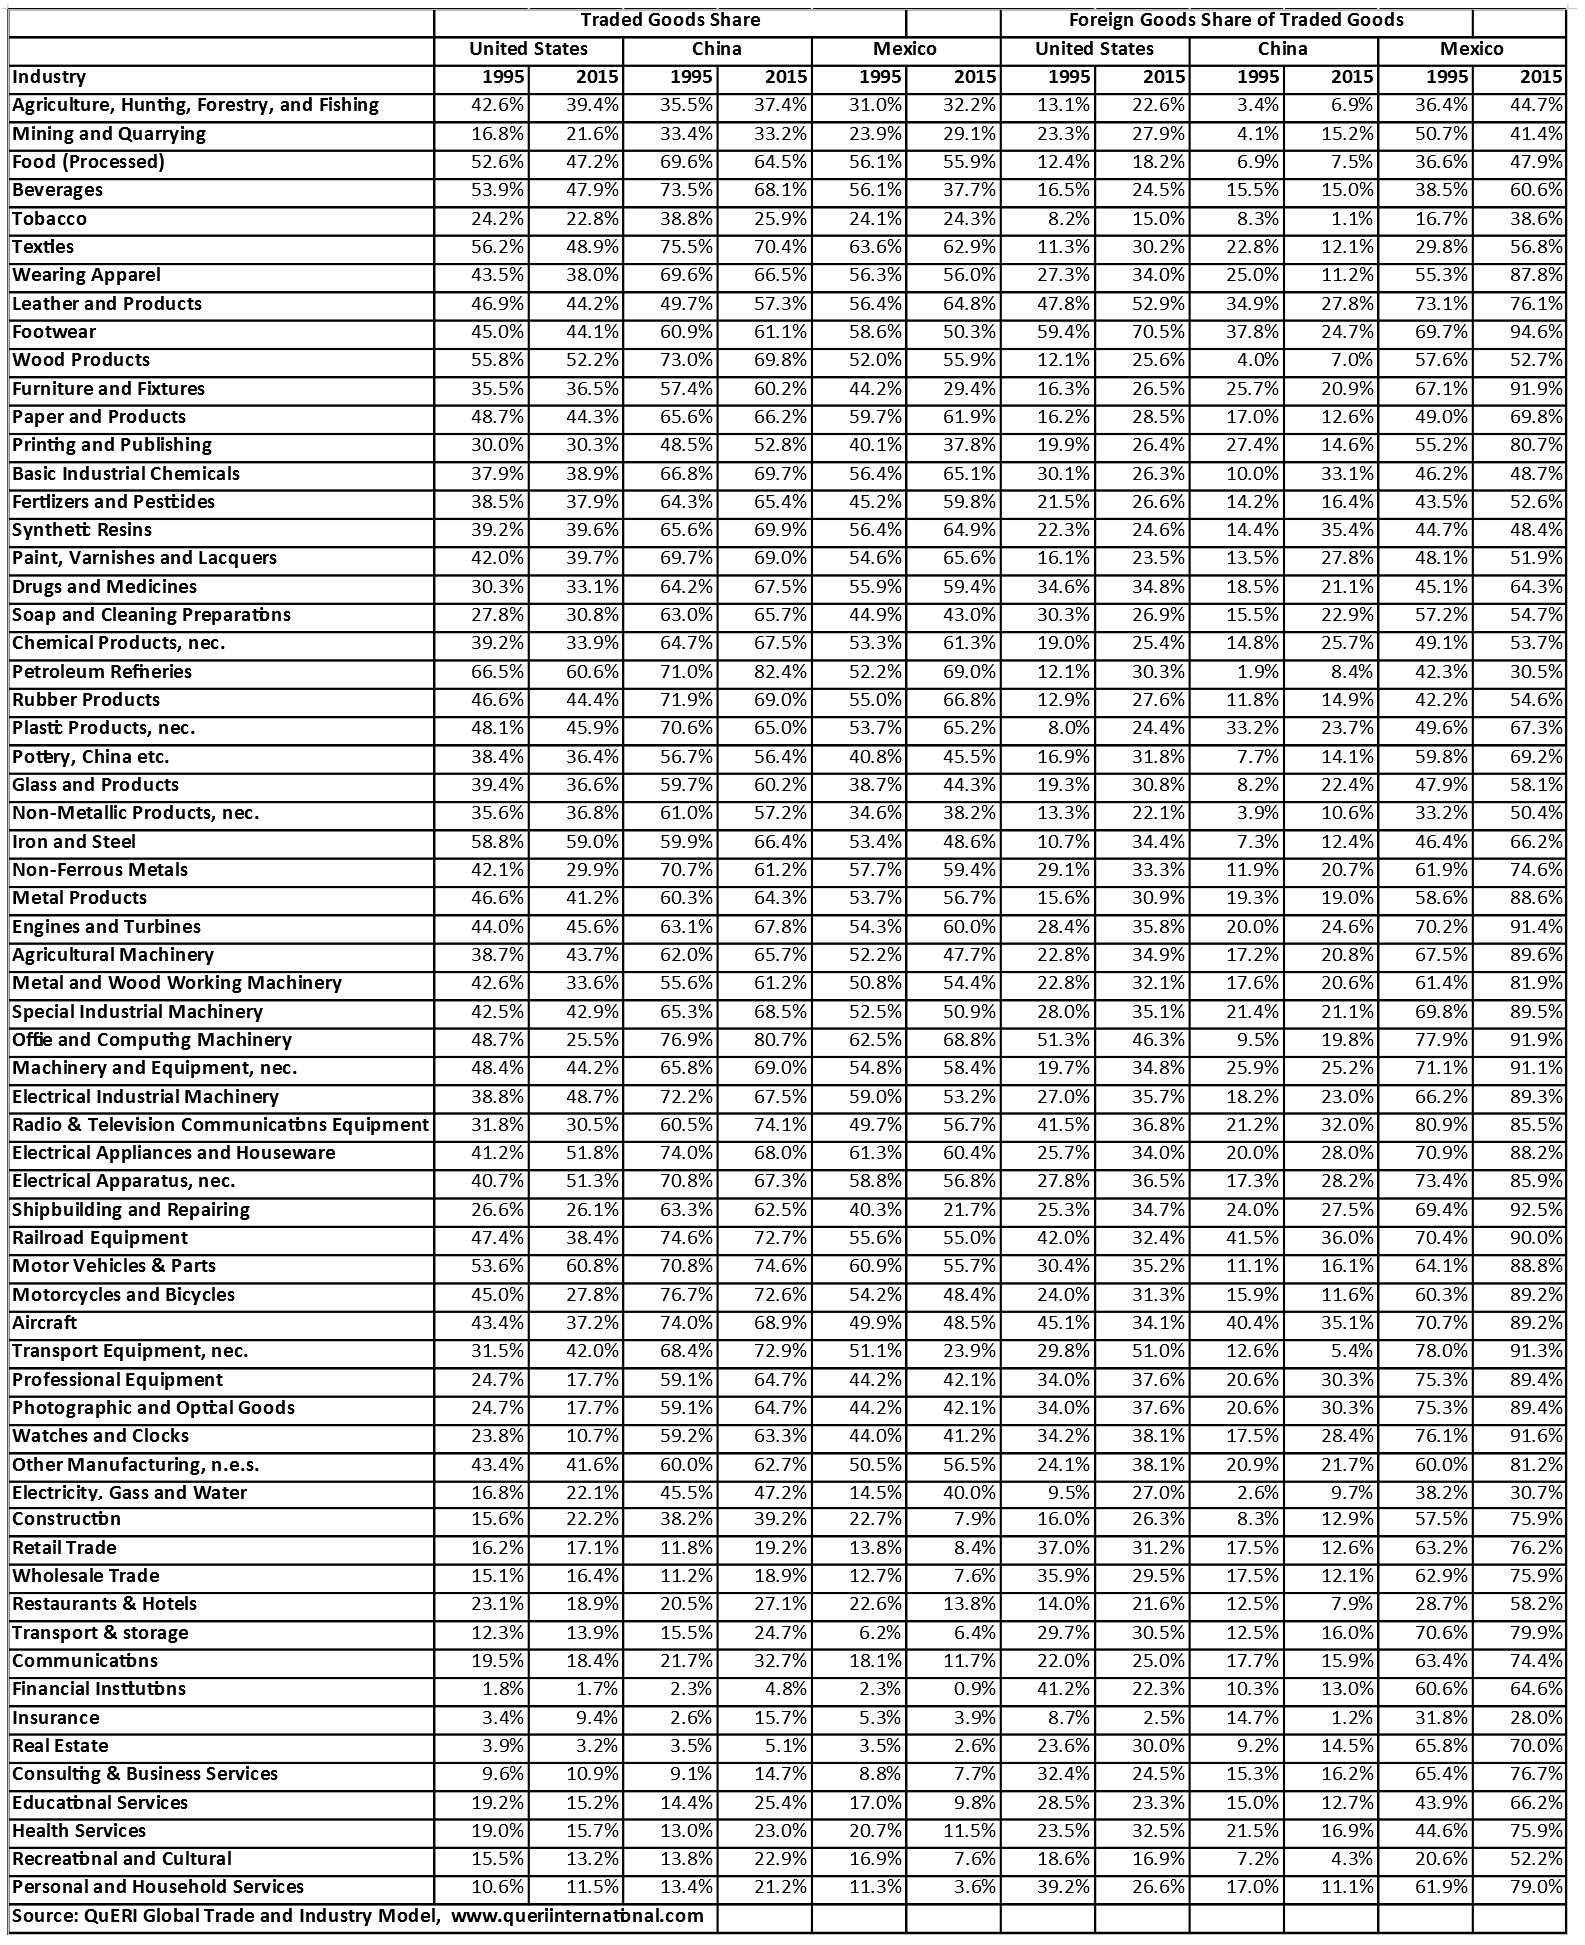 Traded Goods[/caption]
Measuring Employment Losses – Deficit versus Productivity
The hollowing out of the manufacturing sector for large companies has continued to reduce the share of traded goods in the domestic manufacturing input-output formula. The cookbook recipe described in tables for the US, China and Mexico illustrates this quite well. The proportion of factors needed to make something should be about the same in each country except it is not the same. The differences come in part from the degree to which the companies rely upon outside suppliers – domestic and foreign – to do what used to be done in-house. The vertical integration of the past has given way to a more distributed system relying upon global supply chains and outside sources of supply for semi-finished manufactures.
There are many ways to measure trade’s impact on employment. Given the better data available only from 1996 we use the employment/output factor for this year to fix the employment and compare this to the yearly employment per unit of output. If the productivity had stagnated then the actual damage to US employment from the deficit would have been significantly larger – 4.3 million jobs compared to 1.6 million direct employment losses alone. At most around 3 million jobs are lost due to the trade deficit. This is a full in cost including intermediate transactions lost. Productivity improvements in manufacturing, many due to the transfer of lower value intermediates to foreign suppliers may account for the drop in manufacturing employment. In 2015 if there had been no change in productivity the total employment would be 29.7 million compared to 10.9 million jobs actually reported. Jobs per million 1995 dollars declined from 4.3 to 1.69. Manufacturing job loss, while possibly as much as 3 million jobs in 2015 taking into account indirect measures, is only one factor in explaining the number of manufacturing jobs lost. In 1996 there were almost 17 million employed by the manufacturing sector. That number in 2015 is just 10.8 million. If productivity per unit of output had remained fixed at the productivity as of 1996 the total number of manufacturing jobs would have been 29.7 million. The trade deficit --$ 700 billion in 1995 $s ($ 1085 billion with indirect sales included) – reduces employment by 3 million jobs, however, looking at the table below we see without including the second order effects the employment costs of the trade deficit in 1996 was just 1.4 million jobs and in 2015 with the improvements in productivity it was 1.6 million.
Final Thoughts on Trade and Employment
We can’t disengage from the world, the US as we have observed is, at least in terms of trade, the one essential nation. Our currency is the underlying currency used for trade and finance, our companies are engaged in operations worldwide so that there is no single product group that can be made without some kind of foreign content included. The products we buy and sell are more complex, more protected by patents, and often relying on patented inputs that can be made only by one supplier in one country. So any effort to save a 1000 jobs in steel or aluminum will yield higher profits, temporarily for companies protected by these barriers, but in the long run they will be losers as well, as the open markets on which we depend become more compartmentalized.
Over the past forty years that I’ve been working with trade data and developing models to understand at the most basic level how the world operates, I’ve seen it all. I watched, when I built the first commercial model for trade at a commodity and bilateral or trade route level to help the ocean shipping and air freight industries plan, how changes in the Japanese yen’s price from 300 to 100 yielded little in the way of changes in the US-Japanese trade balance due to the Japanese exporters cutting prices to match the loss of dollar purchasing power in the Yen. At the same time, I observed too how discussing trade barriers against automobiles and semi-conductors shifted meant that Japanese companies began to build operations in the United States. Frictions with respect to trade caused by Trump like threats may be useful, at least in some cases, to change industry behavior.
As the chart shows the 1990’s into the first part of the next century were periods of rapid and sustained growth in world trade. The high point came in 1998-2000. The United States economy was booming and the formerly rapidly growing countries of Asia, Latin America, and Eastern Europe had slowed with currencies collapsing as roaring stock markets turned south. Over the next nearly ten years, until the 2007-09 financial crisis, there was a gradual increase in the share of world consumption of traded products that came from outside the country. This period of sustained integration helped more countries out of the poverty trap, but at a cost to jobs and incomes in the advanced countries. In some ways the slower growth observed since 2011 through today should have been expected. There is a maximum rate of substitution of traded products for domestically manufactured products and we are reaching a saturation point. The ratio of trade growth to GDP growth no longer averages to 2.0, but is now closer to 1.0. It may creep up after 2025 to around 1.3, but without some sudden explosion in demand and supply, it is unlikely to ever reach 2.0 or greater for more than one year or two over the next decade.
[caption id="attachment_40672" align="aligncenter" width="300"]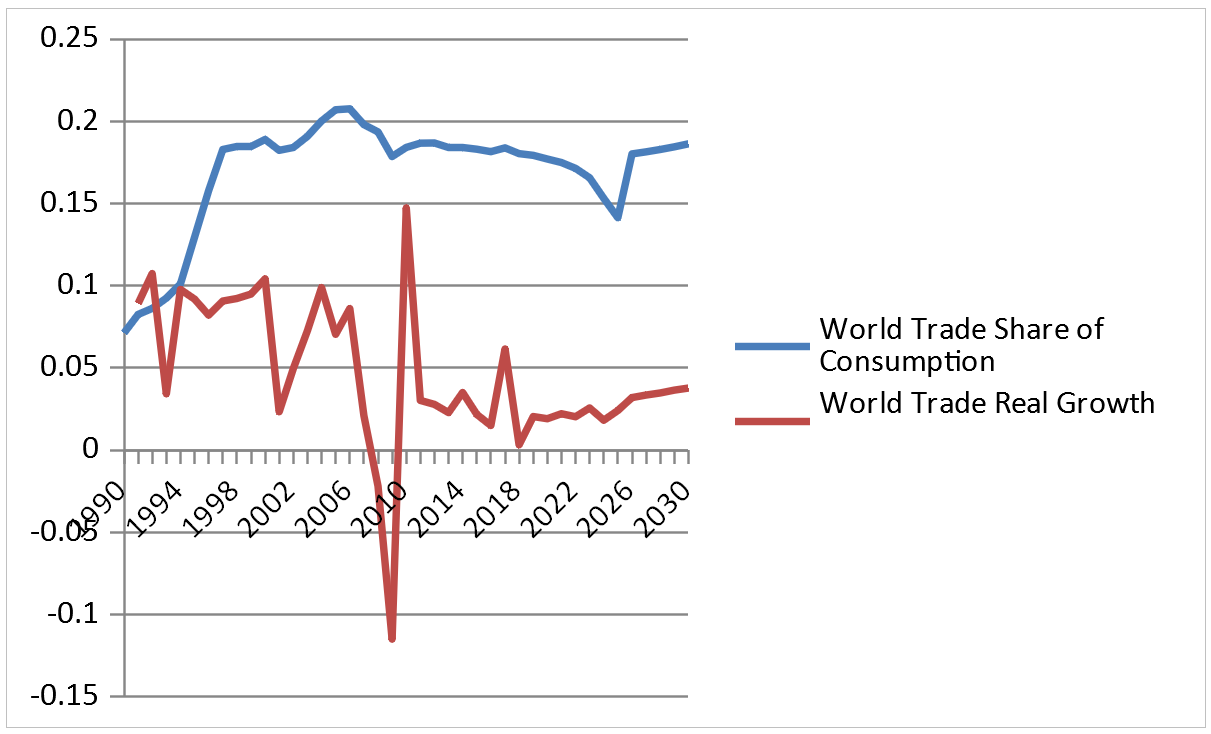 World Trade Share of Consumption / World Trade Real Growth[/caption]
President Trump’s heart is in the right place with respect to wanting to rebuild manufacturing here as it once existed. That style of business organization is dead, not just here, but in other parts of the world as well. Everyone benefited from the specialization that has occurred over the past thirty years. It is not an impossible task, nor is it not prudent to try to reduce the imbalances we have in world trade as a longer term goal, perhaps replacing the dollar as the necessary underpinning to maintain global liquidity with IMF SDR’s as was once the goal. There are good ways of doing this that are less disruptive and less prescriptive. In the past I’ve suggested a couple solutions to reduce the US trade deficit and preserve US manufacturing by slowly winding down the size of the US trade deficit without selecting winners and losers:
(*) A system of import warrants given to exporters or directly issued by the government setting some limit to imports relative to exports. An importer would need to buy on the open market an import warrant before importing the products so that the free market price of the warrant is set by the market. Such a system could slowly push the trade deficit down without choosing winners and losers.
(*) Changing the corporate tax code so that companies buying more in the United States and selling more outside the country would pay a lower tax rate on profits, while companies selling more in the US and buying less here would pay a higher marginal tax rate.
(*) Working with the rest of the world to change WTO rules making it mandatory that countries running a trade deficit more than 1% of their GDP must impose a 10% surcharge on imports; while a country running a surplus more than 1% of GDP must impose a 10% surcharge on export prices. With these rules applying to both chronic deficit and chronic surplus countries we expect a gradual adjustment and reduction in global trade imbalances.
David L. Blond, Ph.D
President, QuERI-Internatonal, Washington, D.C.
Dr. David Blond has been studying, using sophisticated models and quantitative methods, the impact of trade on a countries growth and development for more than forty years. The QuERI Global Trade and Industry model is the most complex model of the global economy covering 72 countries and more than 400 industries. It can be used to more precisely measure the impact of tariffs, including the 25% steel and 10% aluminum tariffs on the US and other economies in a multi-sector world. For more information on the model and for developing consulting assignments, please contact David. Blond at 301-704-8942 or [email protected].
Queri-International specializes in developing models and providing analysis for companies and governments using econometric techniques using proprietary data from its large global data bases combined with other data from public and private sources. For more information contact Dr. Blond at [email protected], www.queriinternational.com.
(1) In my economic trilogy, The Phoenix Year, Wattle Publishing, 2014, fiction of course, I make companies in the final volume do what is unnatural, hire when there is a deep recession, invest and hire, all in the name of cooperative growth. To do this I have to destroy private wealth concentrating the ownership of 200 plus of the largest companies in a single Trust dedicated to solving problems globally. In the real world, however, no CEO can afford in this highly analytical financially driven economy to take losses in the hope that other companies follow the same path in order to grow the economy when there is a recession or worse, a depression.
Links to other websites or electronic media controlled or offered by Third-Parties (non-affiliates of Cumberland Advisors) are provided only as a reference and courtesy to our users. Cumberland Advisors has no control over such websites, does not recommend or endorse any opinions, ideas, products, information, or content of such sites, and makes no warranties as to the accuracy, completeness, reliability or suitability of their content. Cumberland Advisors hereby disclaims liability for any information, materials, products or services posted or offered at any of the Third-Party websites. The Third-Party may have a privacy and/or security policy different from that of Cumberland Advisors. Therefore, please refer to the specific privacy and security policies of the Third-Party when accessing their websites.
Sign up for our FREE Cumberland Market Commentaries
Cumberland Advisors Market Commentaries offer insights and analysis on upcoming, important economic issues that potentially impact global financial markets. Our team shares their thinking on global economic developments, market news and other factors that often influence investment opportunities and strategies.
