The bond market saw the US Treasury close the quarter with unprecedented volatility, spurred by the banking crises that began on March 9th, which saw the FDIC take over both Silicon Valley Bank and the Signature Bank of New York. Add to this the forced takeover of Credit Suisse by UBS, and you have the backdrop for increased volatility as we head towards the end of the quarter.
The chart below shows the daily yield changes of the 2-, 5-, 10-, and 30-year Treasury bonds going back to mid-February.
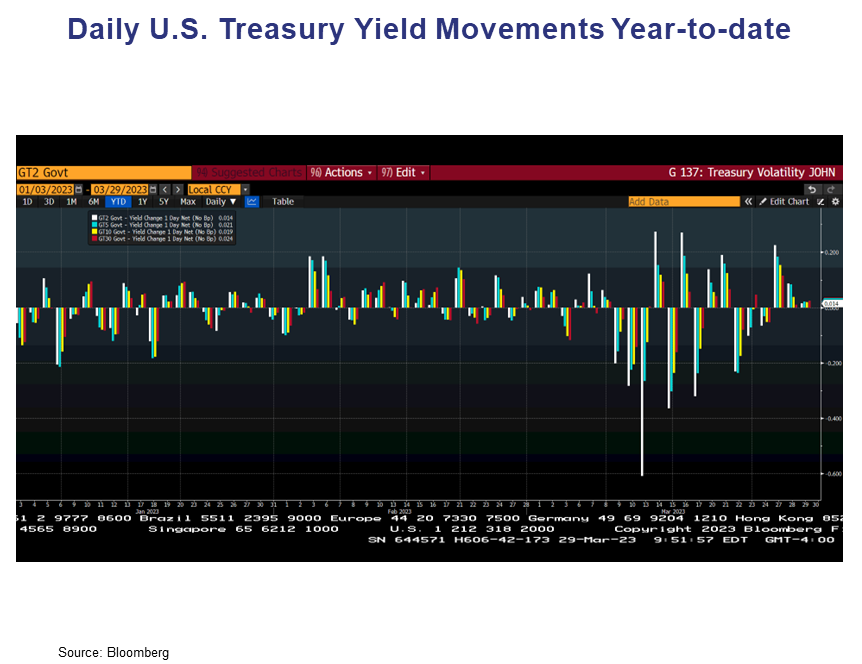
The volatility since the Federal Reserve stepped in and insured Silicon Valley Bank depositors on March 10th is almost unprecedented. And, as we saw from Jay Powell’s speech after the Fed’s rate hike of 25 basis points on March 22nd, the volatility in the market gave the Fed room to CONSIDER pausing in their rate hikes. They ultimately decided to raise the Federal Funds Target rate another 25 basis points to 4.75%–5.00%.
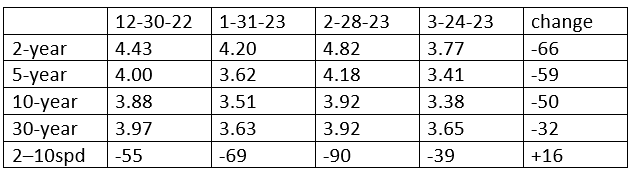
The volatility in the Treasury has driven rates lower since the beginning of the year.
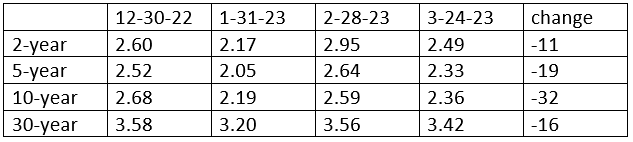
Tax-Free AAA bond yields were also lower but didn’t display the volatility we had in US Treasury bonds.
The quarter was marked by a drop in yields in all bond categories in January, followed by an increase in yields in February, partly on a strong jobs number but also on the fact that inflation, while declining, is declining on a slowing basis. Below is the year-over-year core inflation.
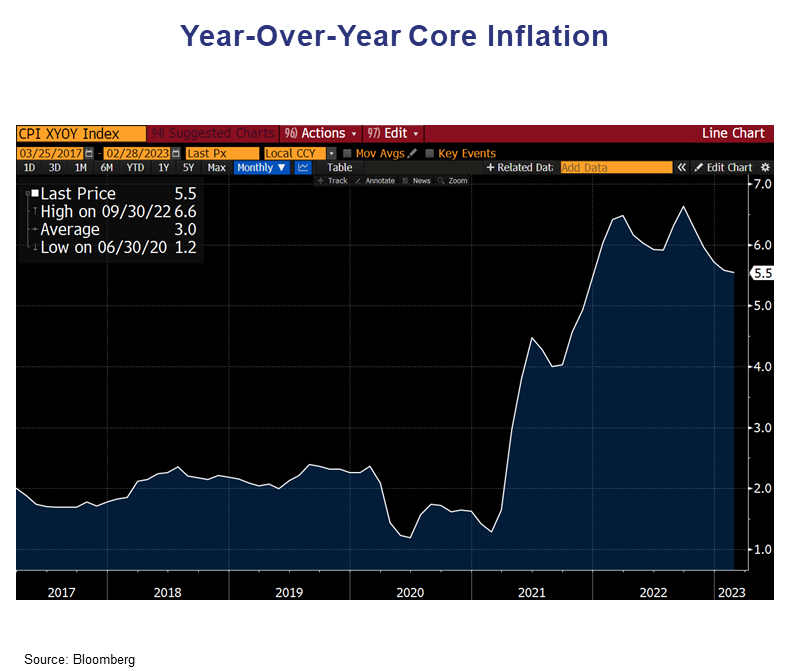
While we feel that inflation will continue to decline, the slowing pace of the decline had been weighing heavily on bond markets — until March 10th when the Silicon Valley Bank’s unraveling began. (See our piece…When Something Breaks https://www.cumber.com/market-commentary/when-something-breaks).
The bond volatility of late March requires some salient points regarding future developments.
1. In two weeks, the inverted yield curve spread between 2 years and 10 years became LESS negative, moving from -108 on March 8th to -39 at close of business on Friday March 24th. That is a remarkable move in a little over two weeks. It certainly reflects the market’s belief that the Fed is closer to ending their hiking cycle, spurred on by the bank developments.
2. Other bond markets have failed to keep up with Treasuries. During the move in the 10-year bond from 4.00% on March 8th to 3.38% on March 24th, the AAA Muni yield moved only 25 bps.
3. Investment-grade corporate spreads moved higher as well. In the 10-year space, that spread moved from +124 to +149 from March 8th to March 24th.
4. Dealers and underwriters in munis were handicapped. With the volatility of Treasuries, it is almost impossible to hedge any position, so clearly there is reluctance on the part of underwriters to price any deal so cheaply that they are guaranteed an oversubscription. But it works the other way too. Municipal issuers are also afraid to come to market with the volatility present in the Treasury market.
Our thoughts are that the Treasury market, for now, is signaling a slowdown and a slower pace and more nuanced Federal Reserve consideration of rate hikes. The issue with banks (reflected in bank stock prices) is clearly fear and might be characterized as fear of fear. We think this fear (and hence the volatility) subsides over time, particularly with the guaranty of deposits. Other economic signs would seem to point to a slowdown. Among these are slowing inflation on a 3- and 6-month annualized basis, the recent drop in housing prices after the big run of the past two years, more and more layoff announcements (which are not picked up in the jobs data until a couple months later), shipping costs, used car prices etc.
One thing we do know is that, with a 10-year US Treasury bond now down at a 3.40% level and a 30-year at 3.65% level, longer tax-free, high-grade bonds in the 4.25%–4.75% remain an absolute bargain.
John R. Mousseau, CFA
President, Chief Executive Officer, & Director of Fixed Income
Email | Bio
Links to other websites or electronic media controlled or offered by Third-Parties (non-affiliates of Cumberland Advisors) are provided only as a reference and courtesy to our users. Cumberland Advisors has no control over such websites, does not recommend or endorse any opinions, ideas, products, information, or content of such sites, and makes no warranties as to the accuracy, completeness, reliability or suitability of their content. Cumberland Advisors hereby disclaims liability for any information, materials, products or services posted or offered at any of the Third-Party websites. The Third-Party may have a privacy and/or security policy different from that of Cumberland Advisors. Therefore, please refer to the specific privacy and security policies of the Third-Party when accessing their websites.
Cumberland Advisors Market Commentaries offer insights and analysis on upcoming, important economic issues that potentially impact global financial markets. Our team shares their thinking on global economic developments, market news and other factors that often influence investment opportunities and strategies.
